Statistics
Statistics interface provides a visual analusis and status of a device and its data. Users can use the data in this interface to analyze the number of online devices, check growth status like user count.
View the count and status of Nodes
Super admin users can select a certain period of time to view the number of nodes within that period of time. The following figure below shows the node information interface.
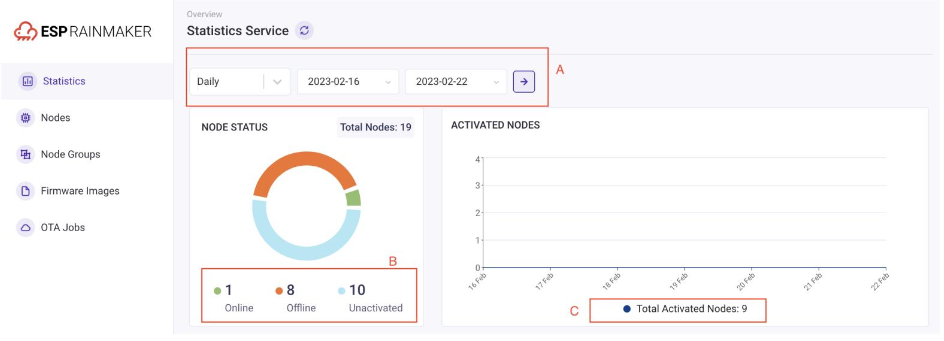
- "A" is the time selection interval.
- Users can not only select the interval, but also select the granularity of the interval.
- Users can not only select the interval, but also select the granularity of the interval.
- "B" is the real-time device node status.
- Users can view the number of offline devices and make judgments based on other functions provided by the dashboard.
- "C" is the growth trend of the number of activated devices in the selected time period.
- Its time granularity is the time step selected in area A.
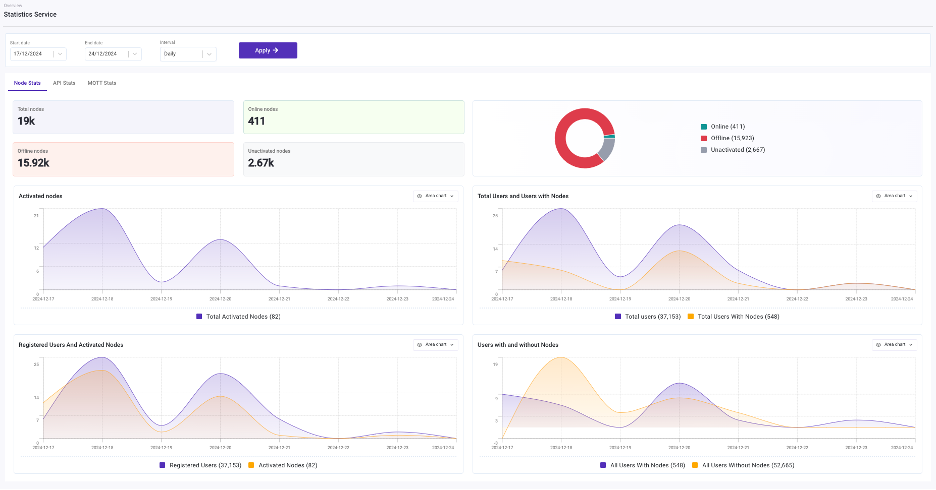
View the number of Users
The statistics function module also provides monitoring of the number of device users. Super Admin users can intuitively view user activity and growth trends through images and use them to analyze the business. The statistics page is in placed with hig-quality charts and enchanced range selection for better usability.
The Node State page provides detailed insghts, including Online, Offline and deactivated nodes. as shown in the figure below.
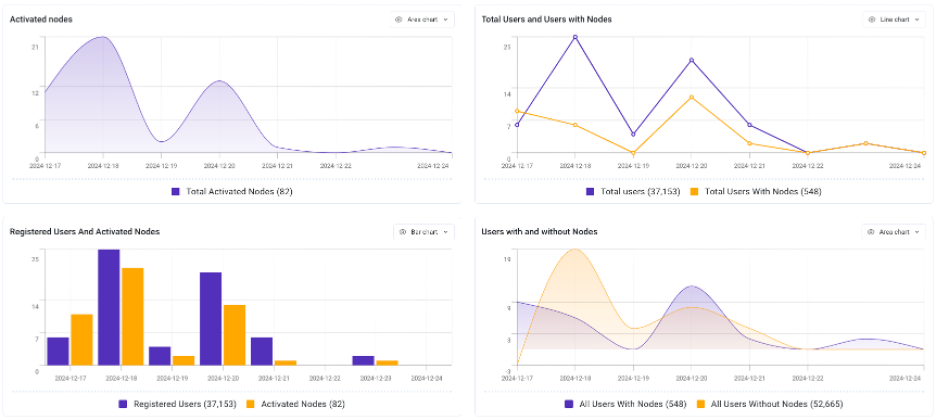
Statistic page supports viewing time series for the Nodes data in multiple chart formats as shown in the figure below.
API and MQTT statistics
Super Admin user is able to also check the statistics for API Usage and MQTT usage.
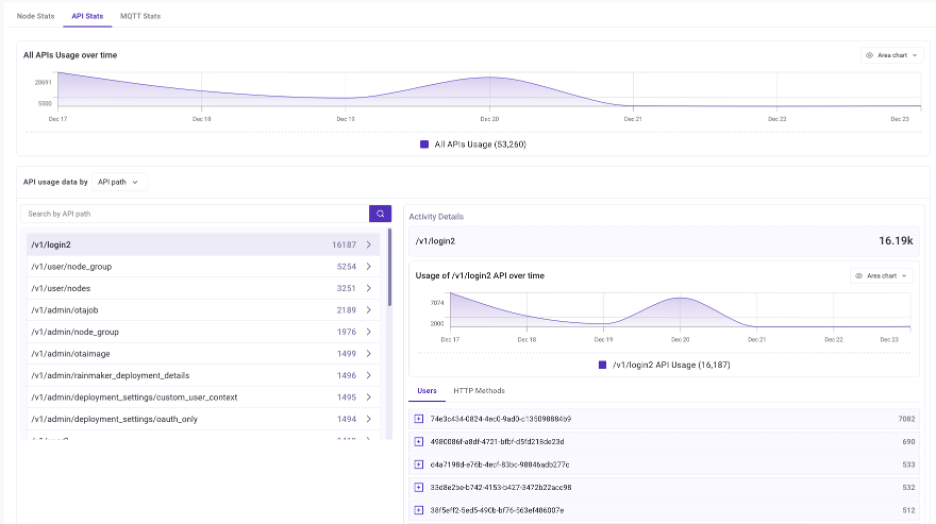
API Stats
API stats can be viewed as a breakdown by API paths. Stats for each API path can further be broken down by users and HTTP methods as shown in the figure below.
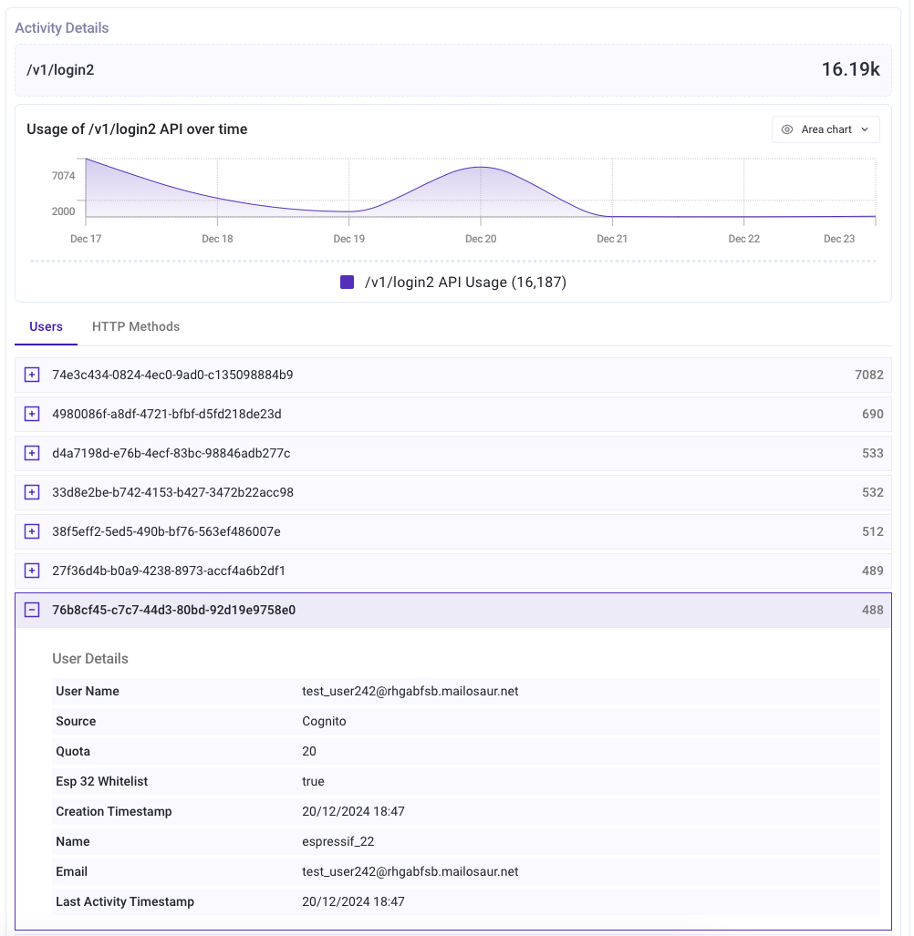
API Path Stats for Users
API path stats can be viewed as a breakdown by users. Clicking on a user ID reveals the primary details of that user.
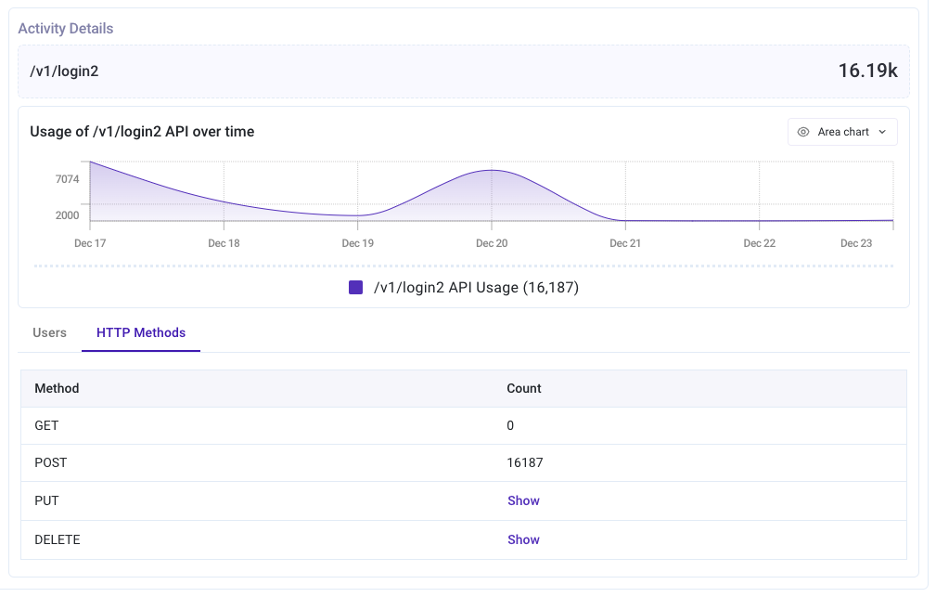
API Path Stats for HTTP Methods
API path stats can be viewed as breakdown by HTTP methods.
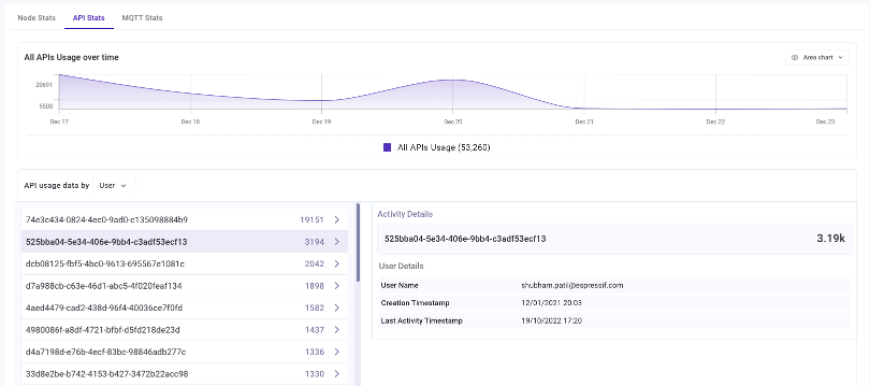
API Stats by Users
All API stats can be viewed as a breakdown by users.
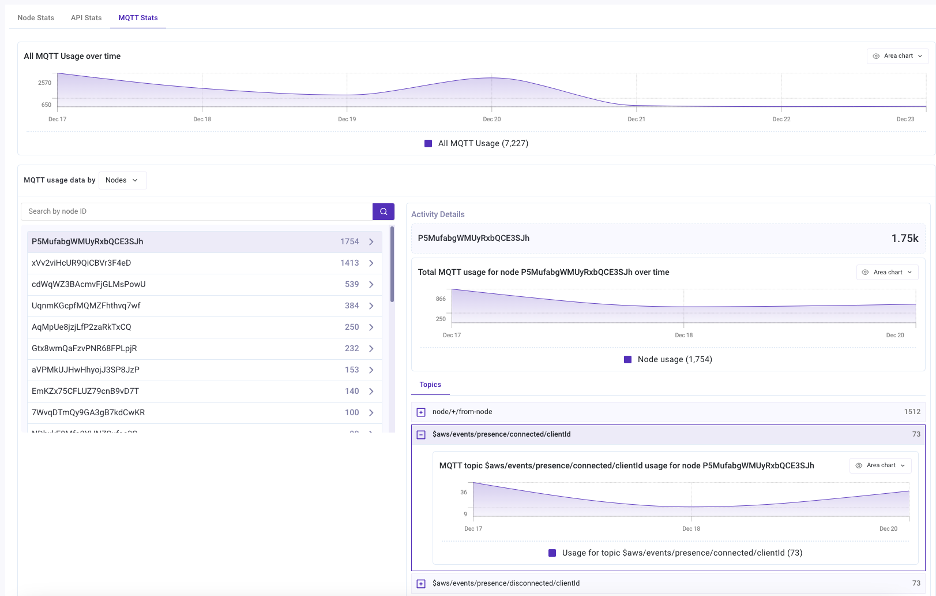
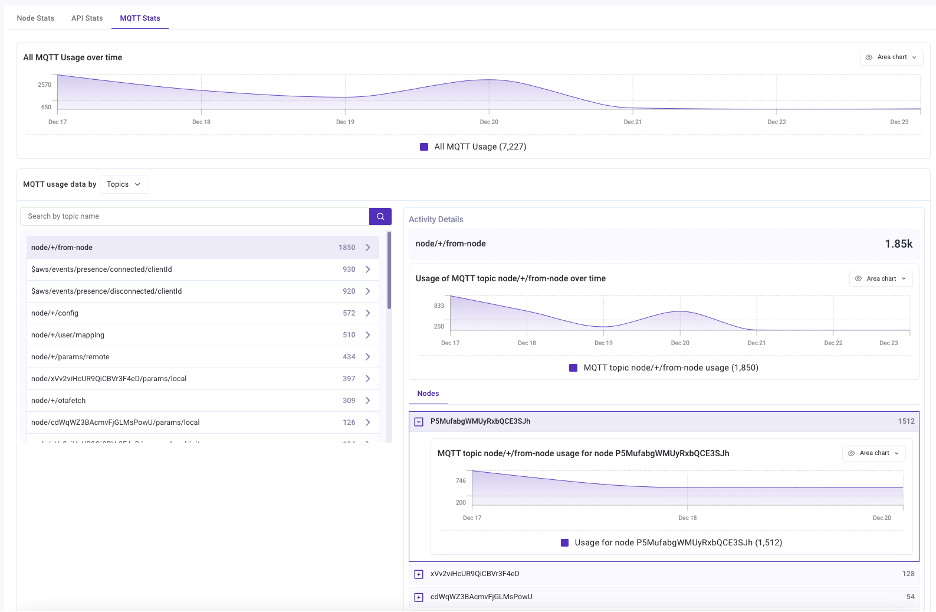
MQTT Stats
All MQTT stats can be viewed as a breakdown by topics. For each topic, stats can further be broken down by nodes.
MQTT Stats Grouped by Nodes
All MQTT stats can be viewed as a breakdown by nodes. For each node, stats can further be broken down by topics.