Nodes
ESP RainMaker manages devices in the form of Nodes. In the node management interface, users can view relevant information and connection status fo node devices.
Node Summary
Users can view the device information bound to the cloud in the initial interface of node management. Including node ID, device name, firmware version, device type (such as light bulb, switch), sub-category, firmware name. Users can directly search for the device information they want to view by entering the node ID.
In addition to the above, the node summary page also shows the following below:
| Node Summary Widget |
|---|
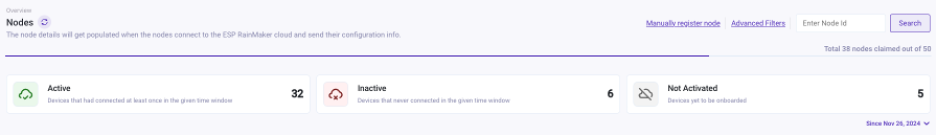 |
- Active nodes: Devices that connected at least once within the selected time window.
- Inactive nodes: Devices that never connected during the selected time window.
- Not Activated nodes: Devices that are yet to be onboarded.
| Custom data details of node |
|---|
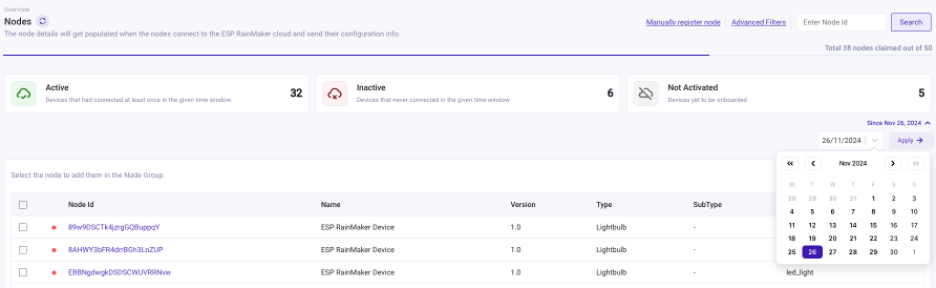 |
- By default, the widget shows data for the past month. Users can also select a custom start date to view data from a specific period as shown in the image above.
Filtering
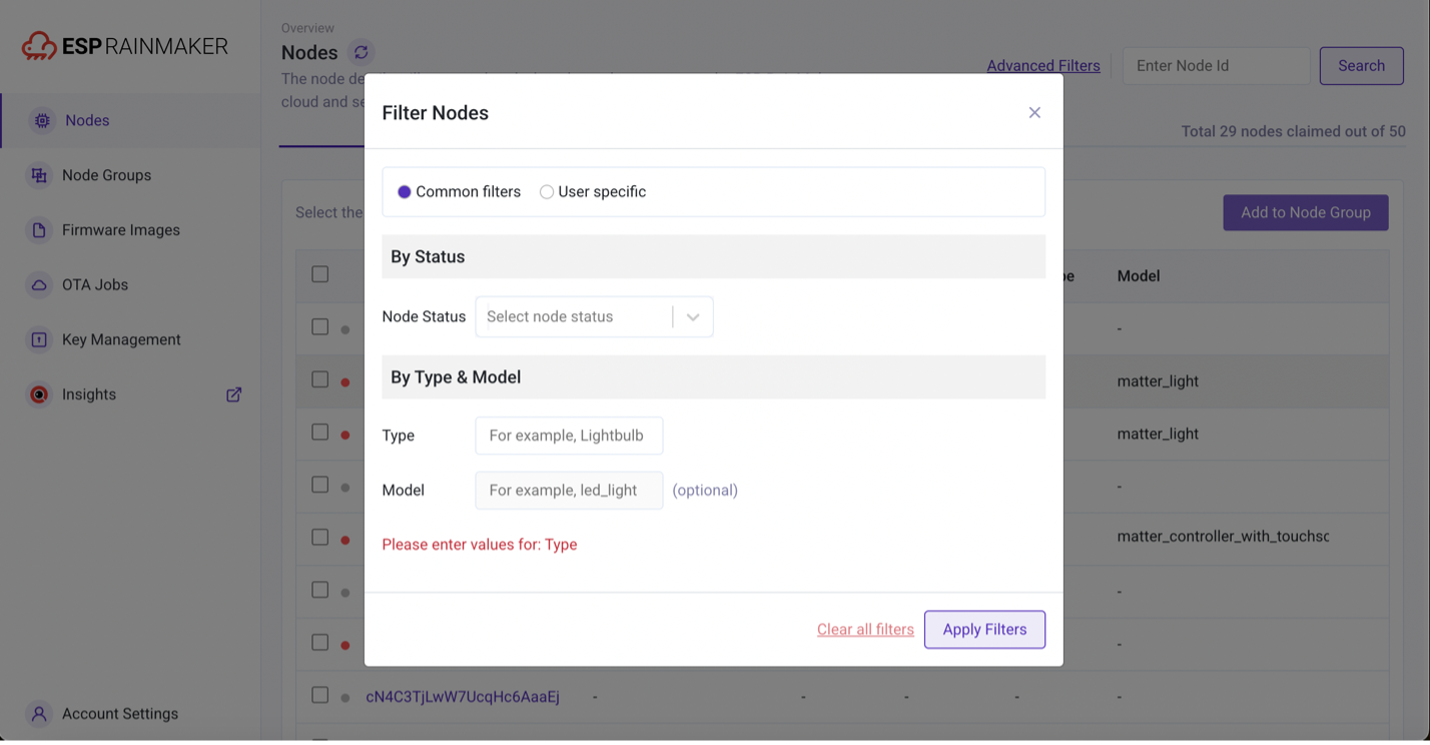
Users can apply filters to search nodes using the Advance Filters Option. The Filters Node popup now includes two categories of filters: Common filters and User specific Filters.
Common Filters
Users can filter nodes based on the Node Status or based on Type or by Model.
User Specific Filters
The User-specific filter category now includes a filter by username section where a text box is provided to enter the username for filtering the nodes.
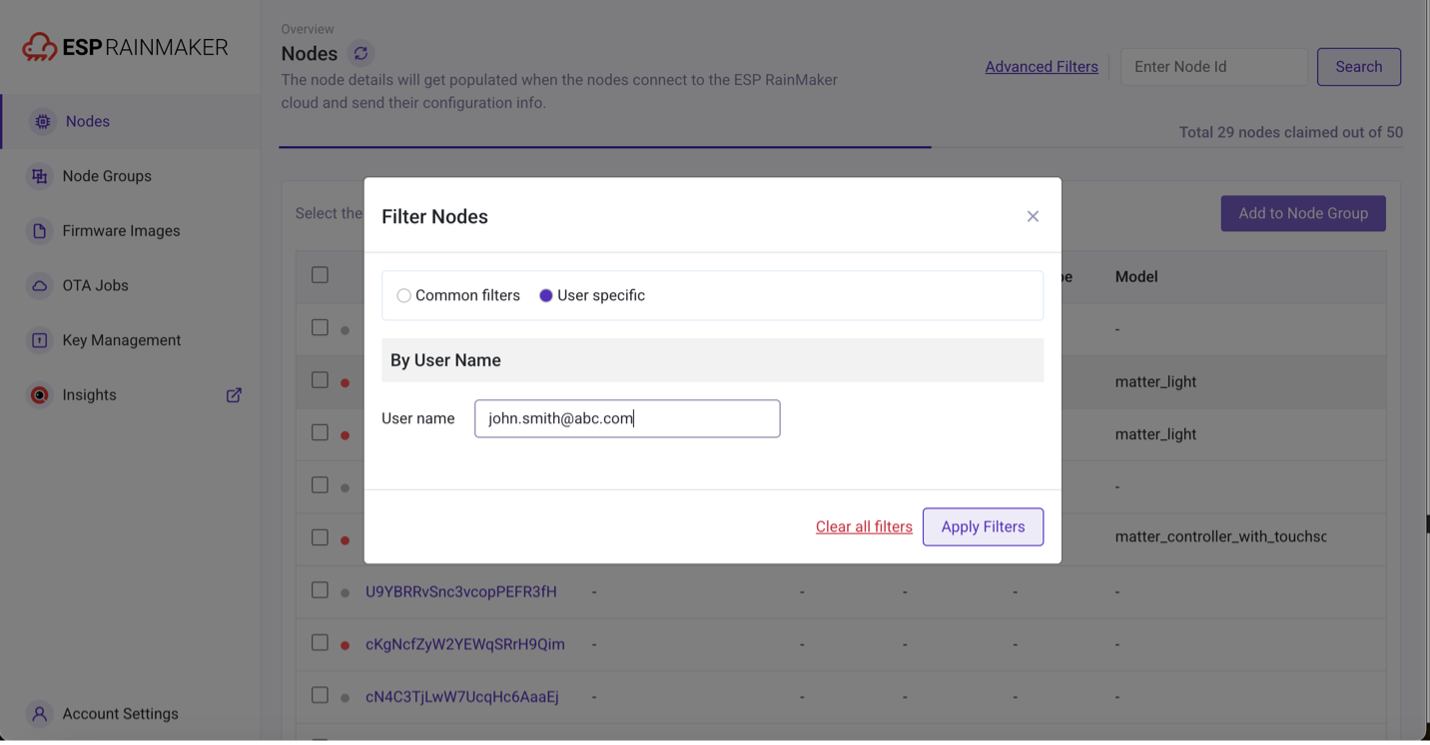
Switching between the filter categories will clear the filter options of the other category.
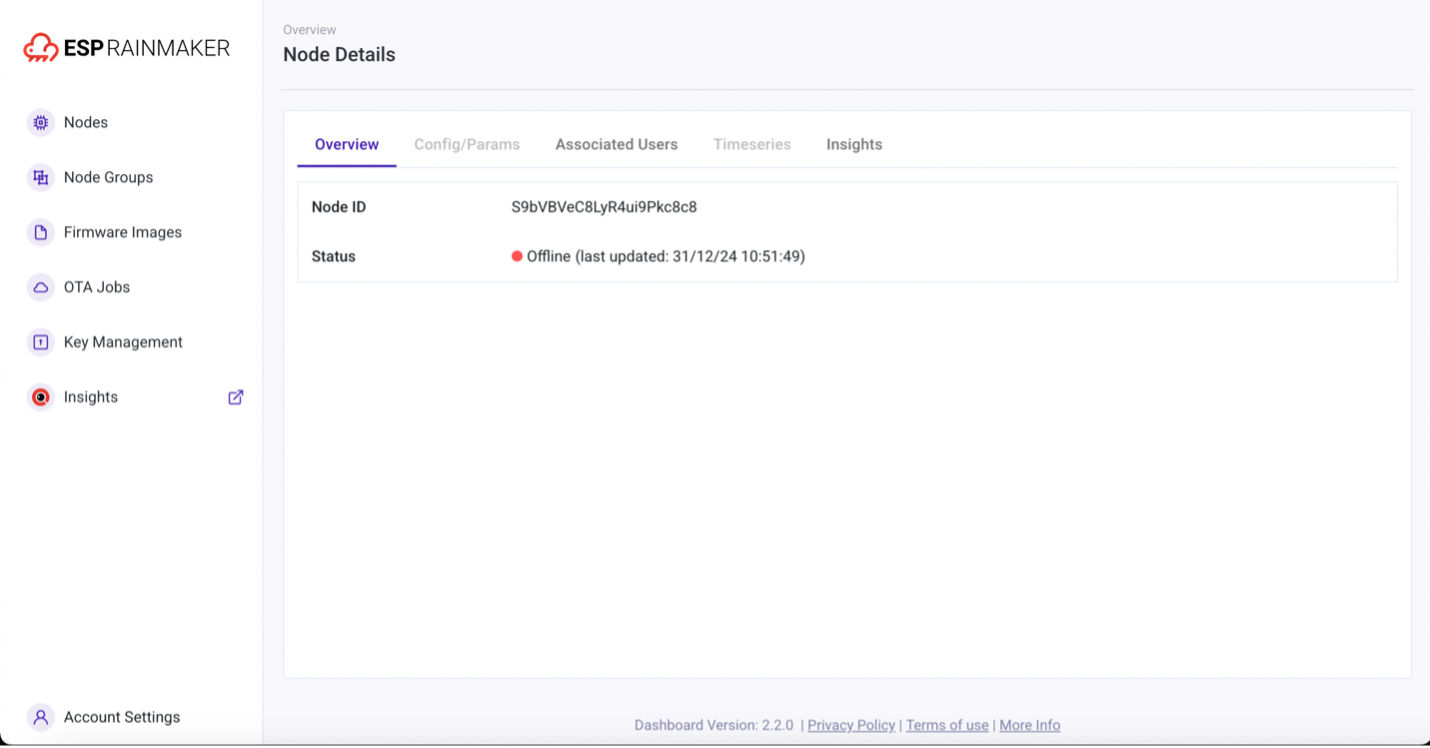
Node Details
When Users click onto node ID, it will jump to "Node details" dashboard interface. If the user has ESP Insights, the interface would display ESP Insights related information. Users are able to get additional and more detailed information about the node by clicking on any of the nodes from the Nodes page.
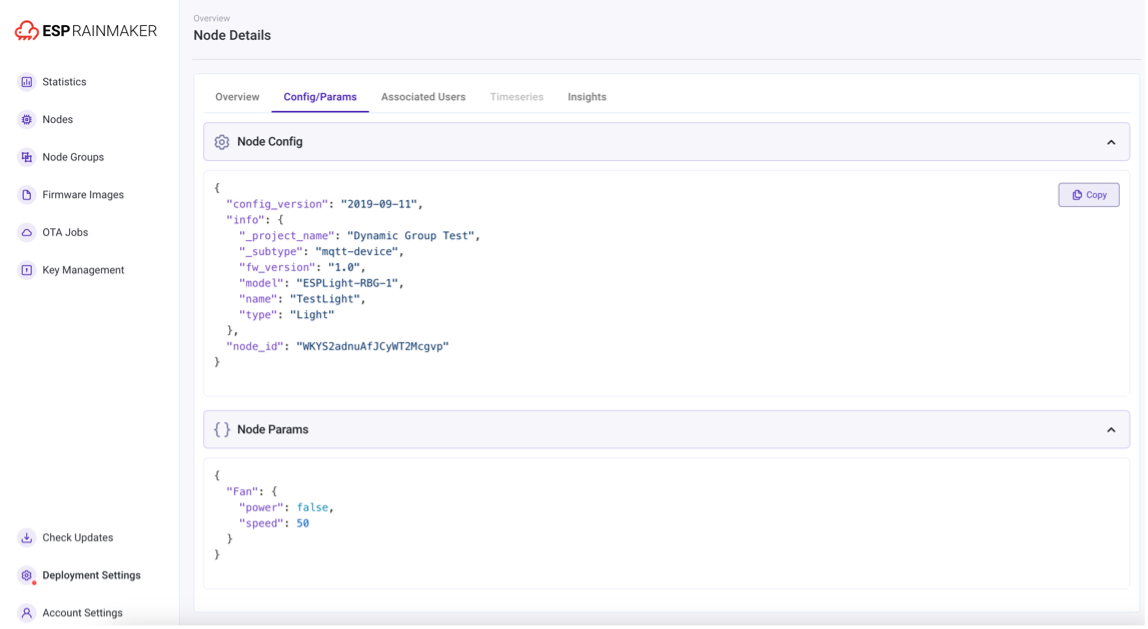
Config/Params
The Config/Params tab displays the configuration and parameters of the node. This tab will be disabled if this information is not available. Users can also copy the JSON data to the clipboard using the Copy button, which appears when hovering over the JSON data.
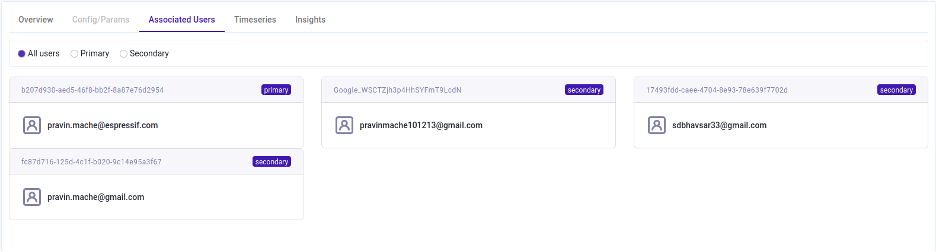
Associated Users
Explore the list of users linked to the node. Click on a user to get more details, including custom user data and other relevant information.
Time-Series Data Visualisation
For nodes configured with time-series parameters, users can now view detailed time-series graphs. Choose from various date ranges and aggregation types, such as raw, average, minimum, and maximum values. Data can be displayed in multiple chart formats or as a table.
| Available Date Range Window Presets |
|---|
| 1 day |
| 7 days |
| 15 days |
| 4 weeks |
| 3 months |
| 1 year |
-
Users can browse data for the next and previous range windows of the selected range preset.
-
Users can choose to view time-series data in any of the following chart types:
Area Chart 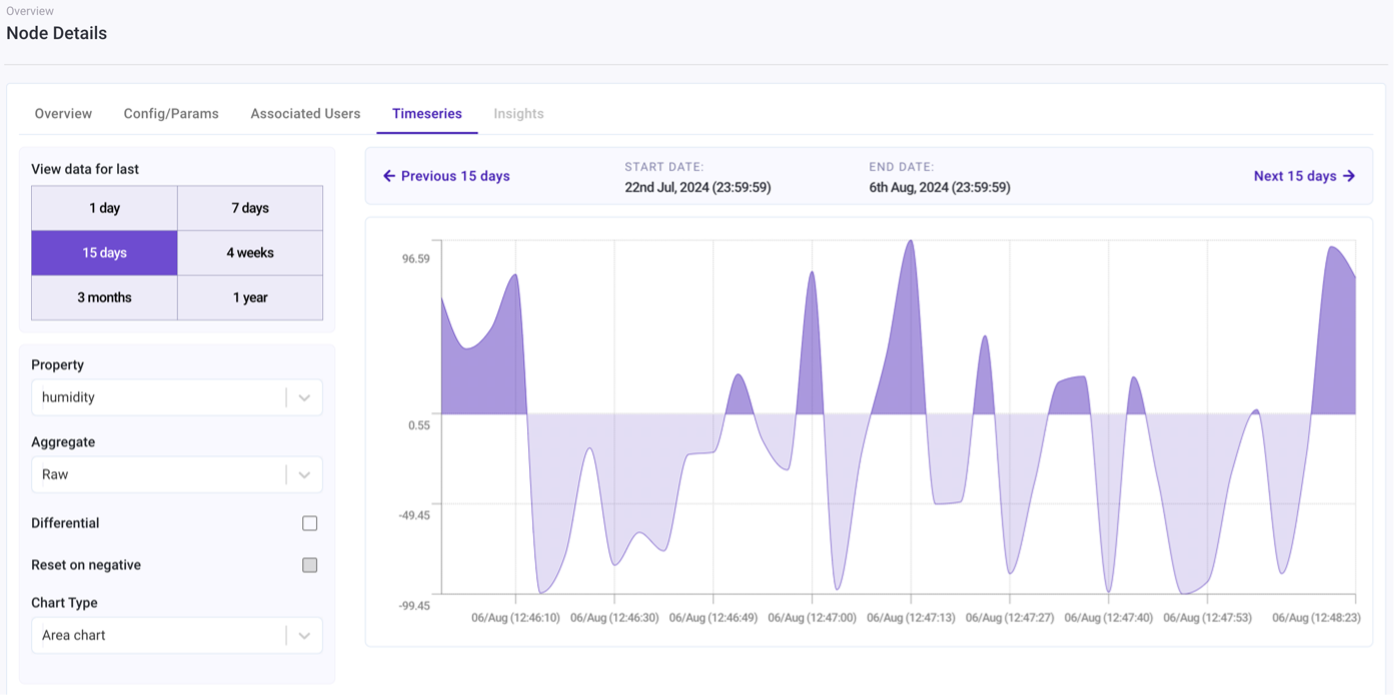
Bar Chart 
Line chart 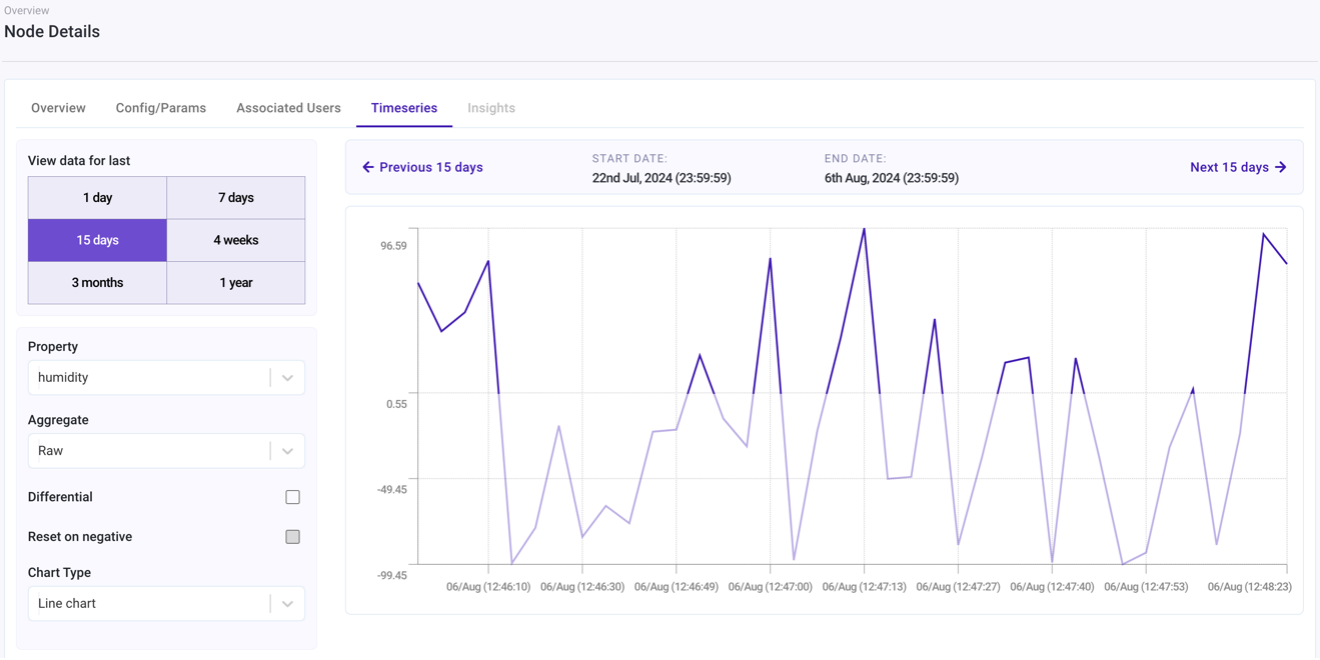 提示
提示Some of these features may require access granted by the primary user, enabled at the deployment level, or allowed through node configuration.
Manage devices in groups
When there are too many devices or you want to manage related devices in combination, you can use the grouping function. Users can create groups and add selected devices to the group for management. First, users need to create a group. The steps are as follows:
- Create a Group
Function bar on the right > Node Group > create group > fill in group information > create group
| In the Group Information Filling Interface, users can use Group Filters to directly save devices with specific attributes into a new Group or create without this to enable manual adding of devices |
|---|
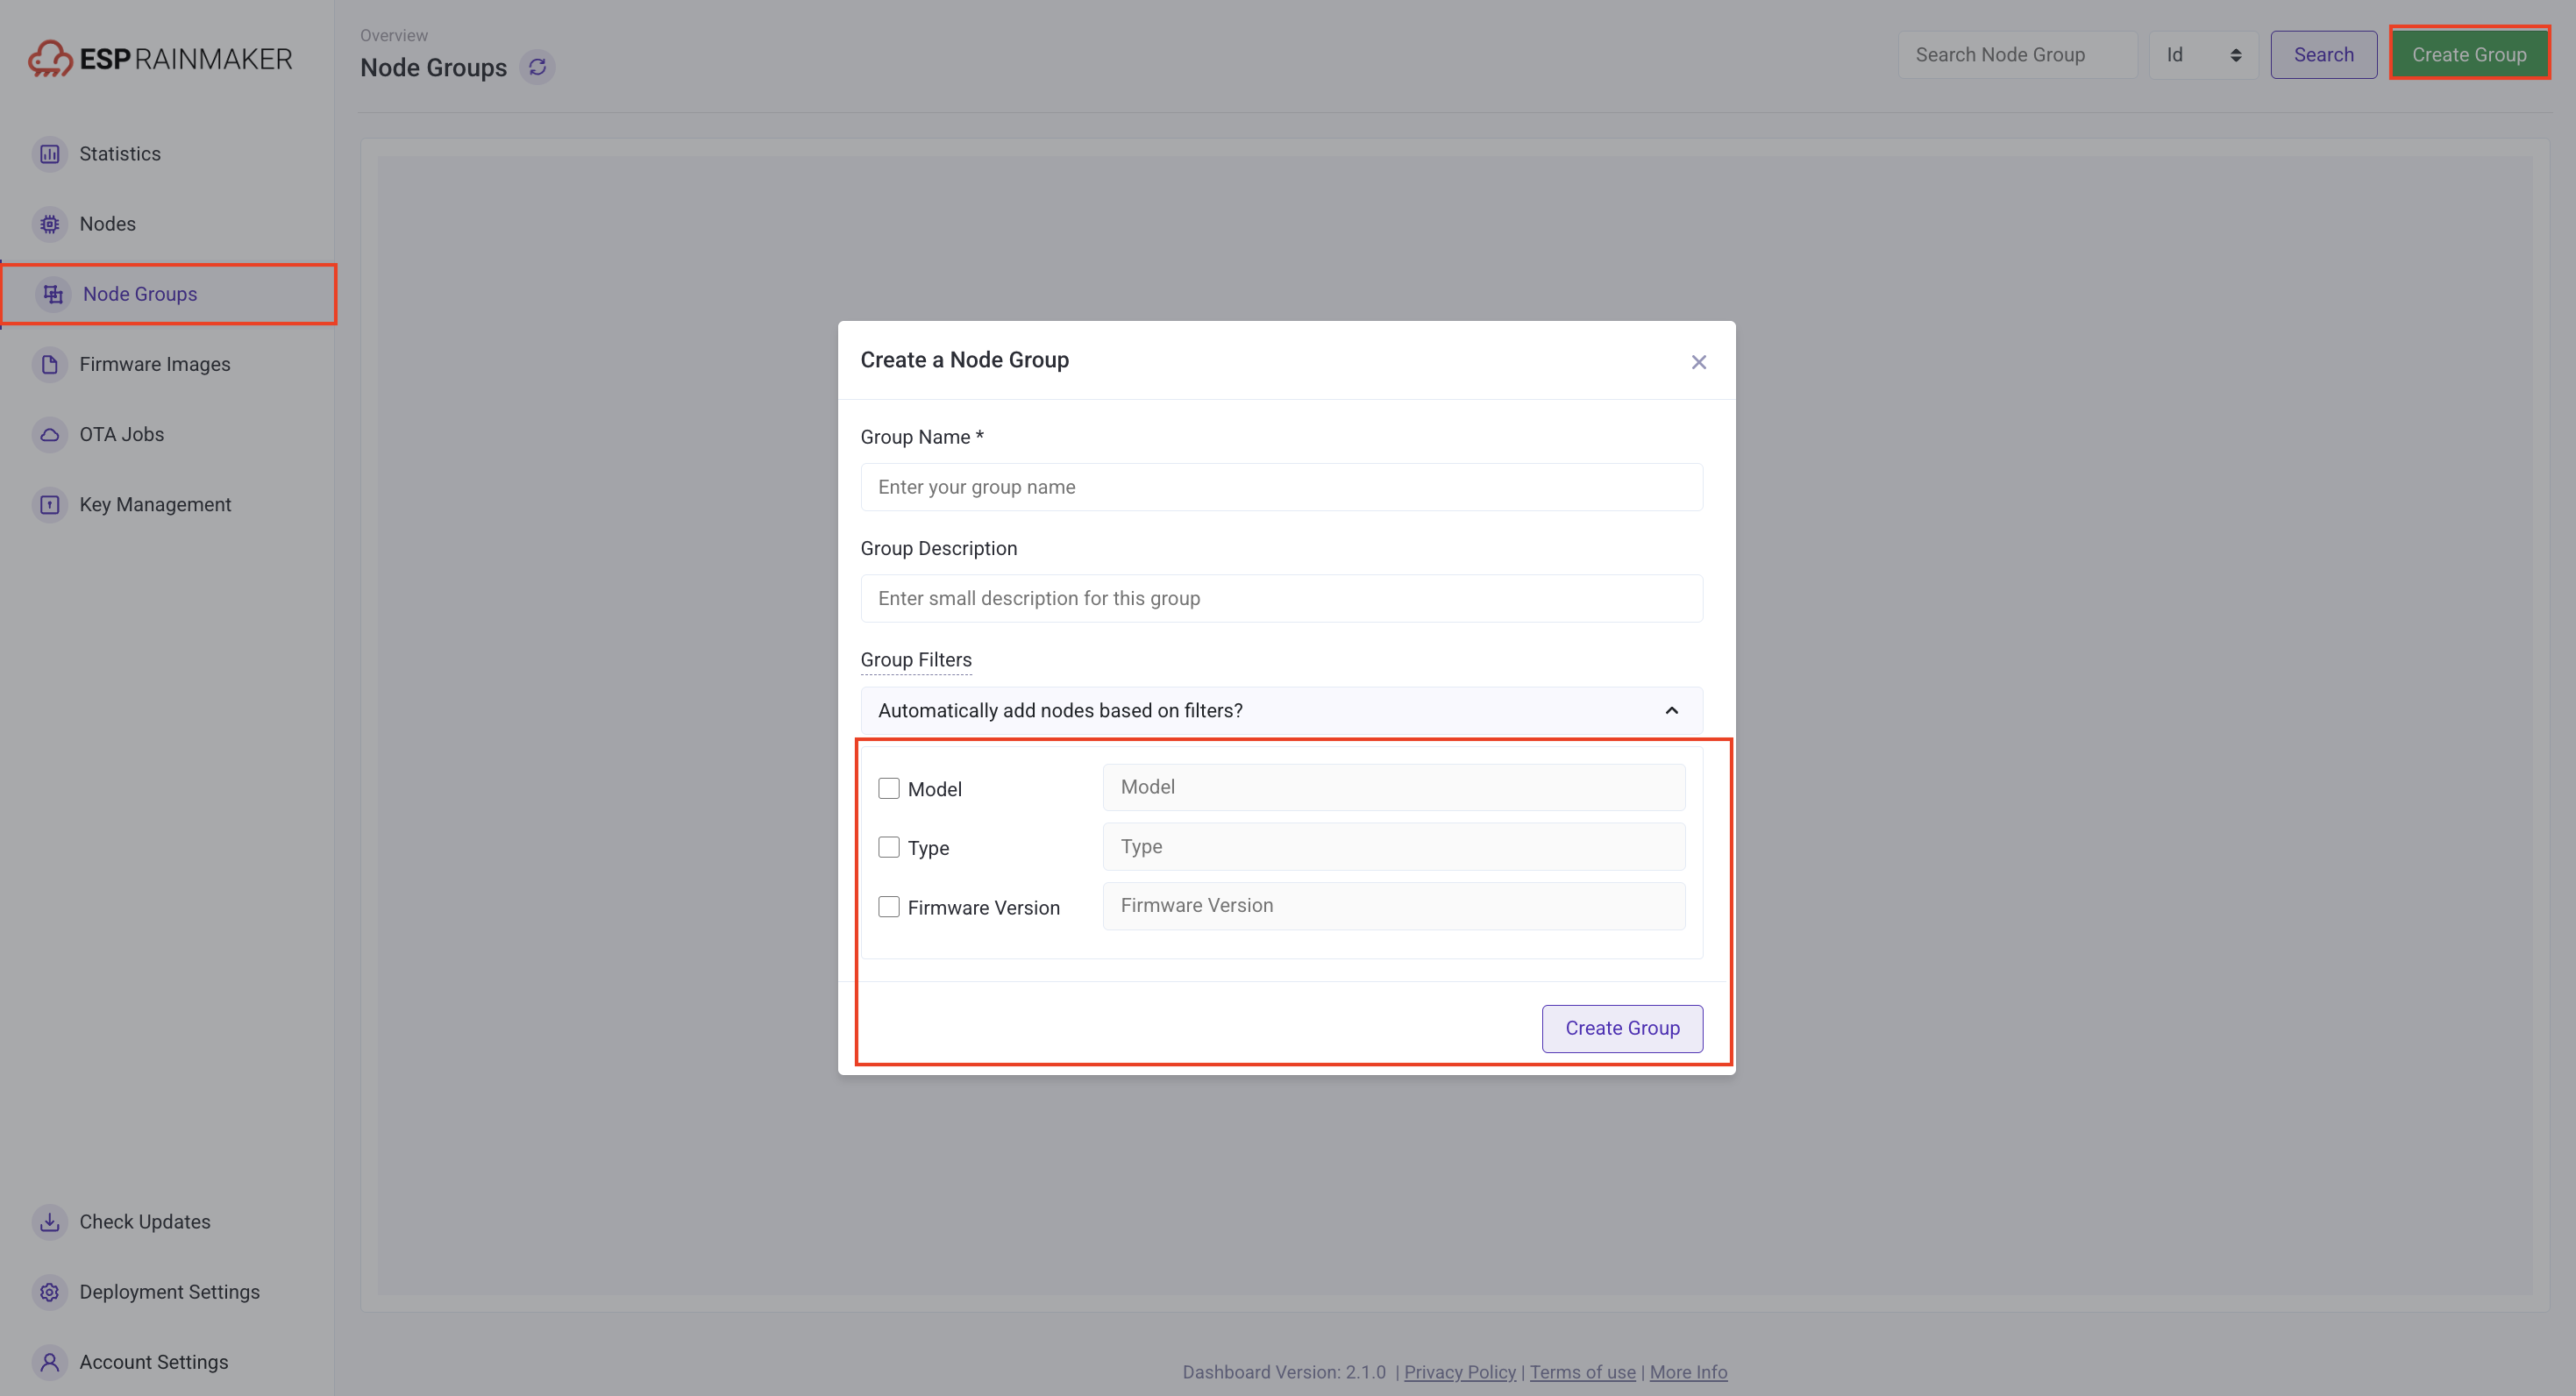 |
| Created Node Group information |
|---|
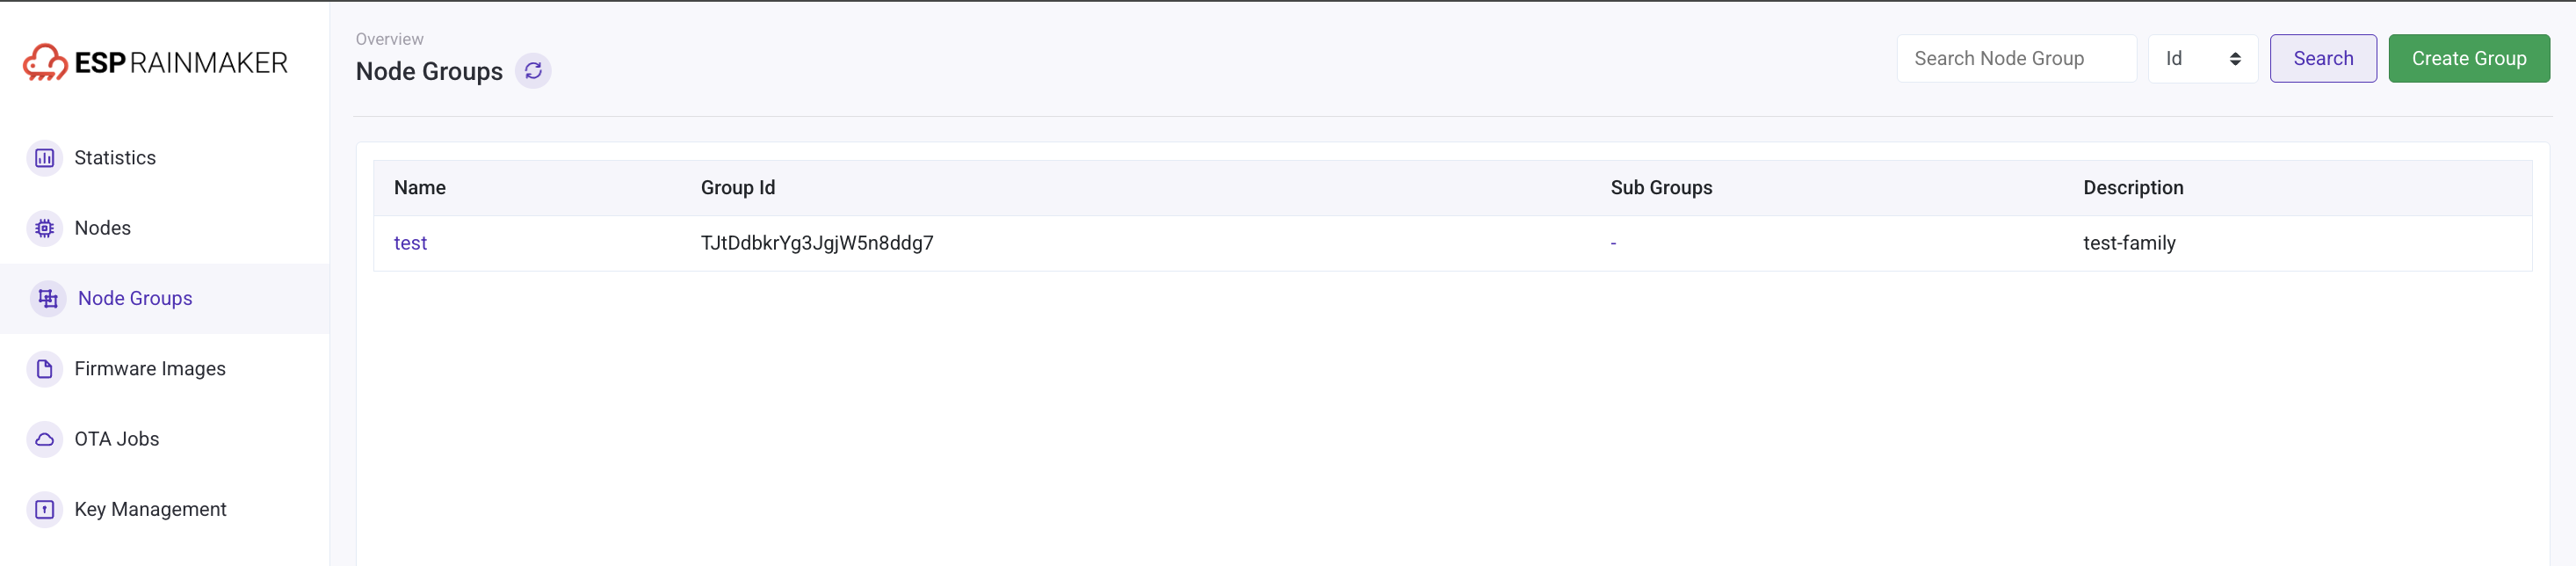 |
| Node Group details After creating a new Group |
|---|
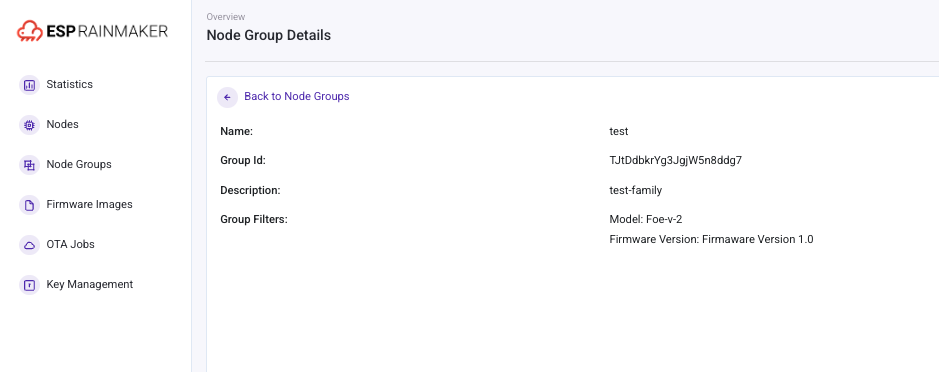 |
When the group creation is complete, the user can view the created Group in the Node Group interface. Clicking the group name will display the device information in the group, as well as the name and ID of the device group.
- Add devices into the newly created group
Nodes > Select the device > add to node group > Select the node group > Confirm
| Adding a node to a group |
|---|
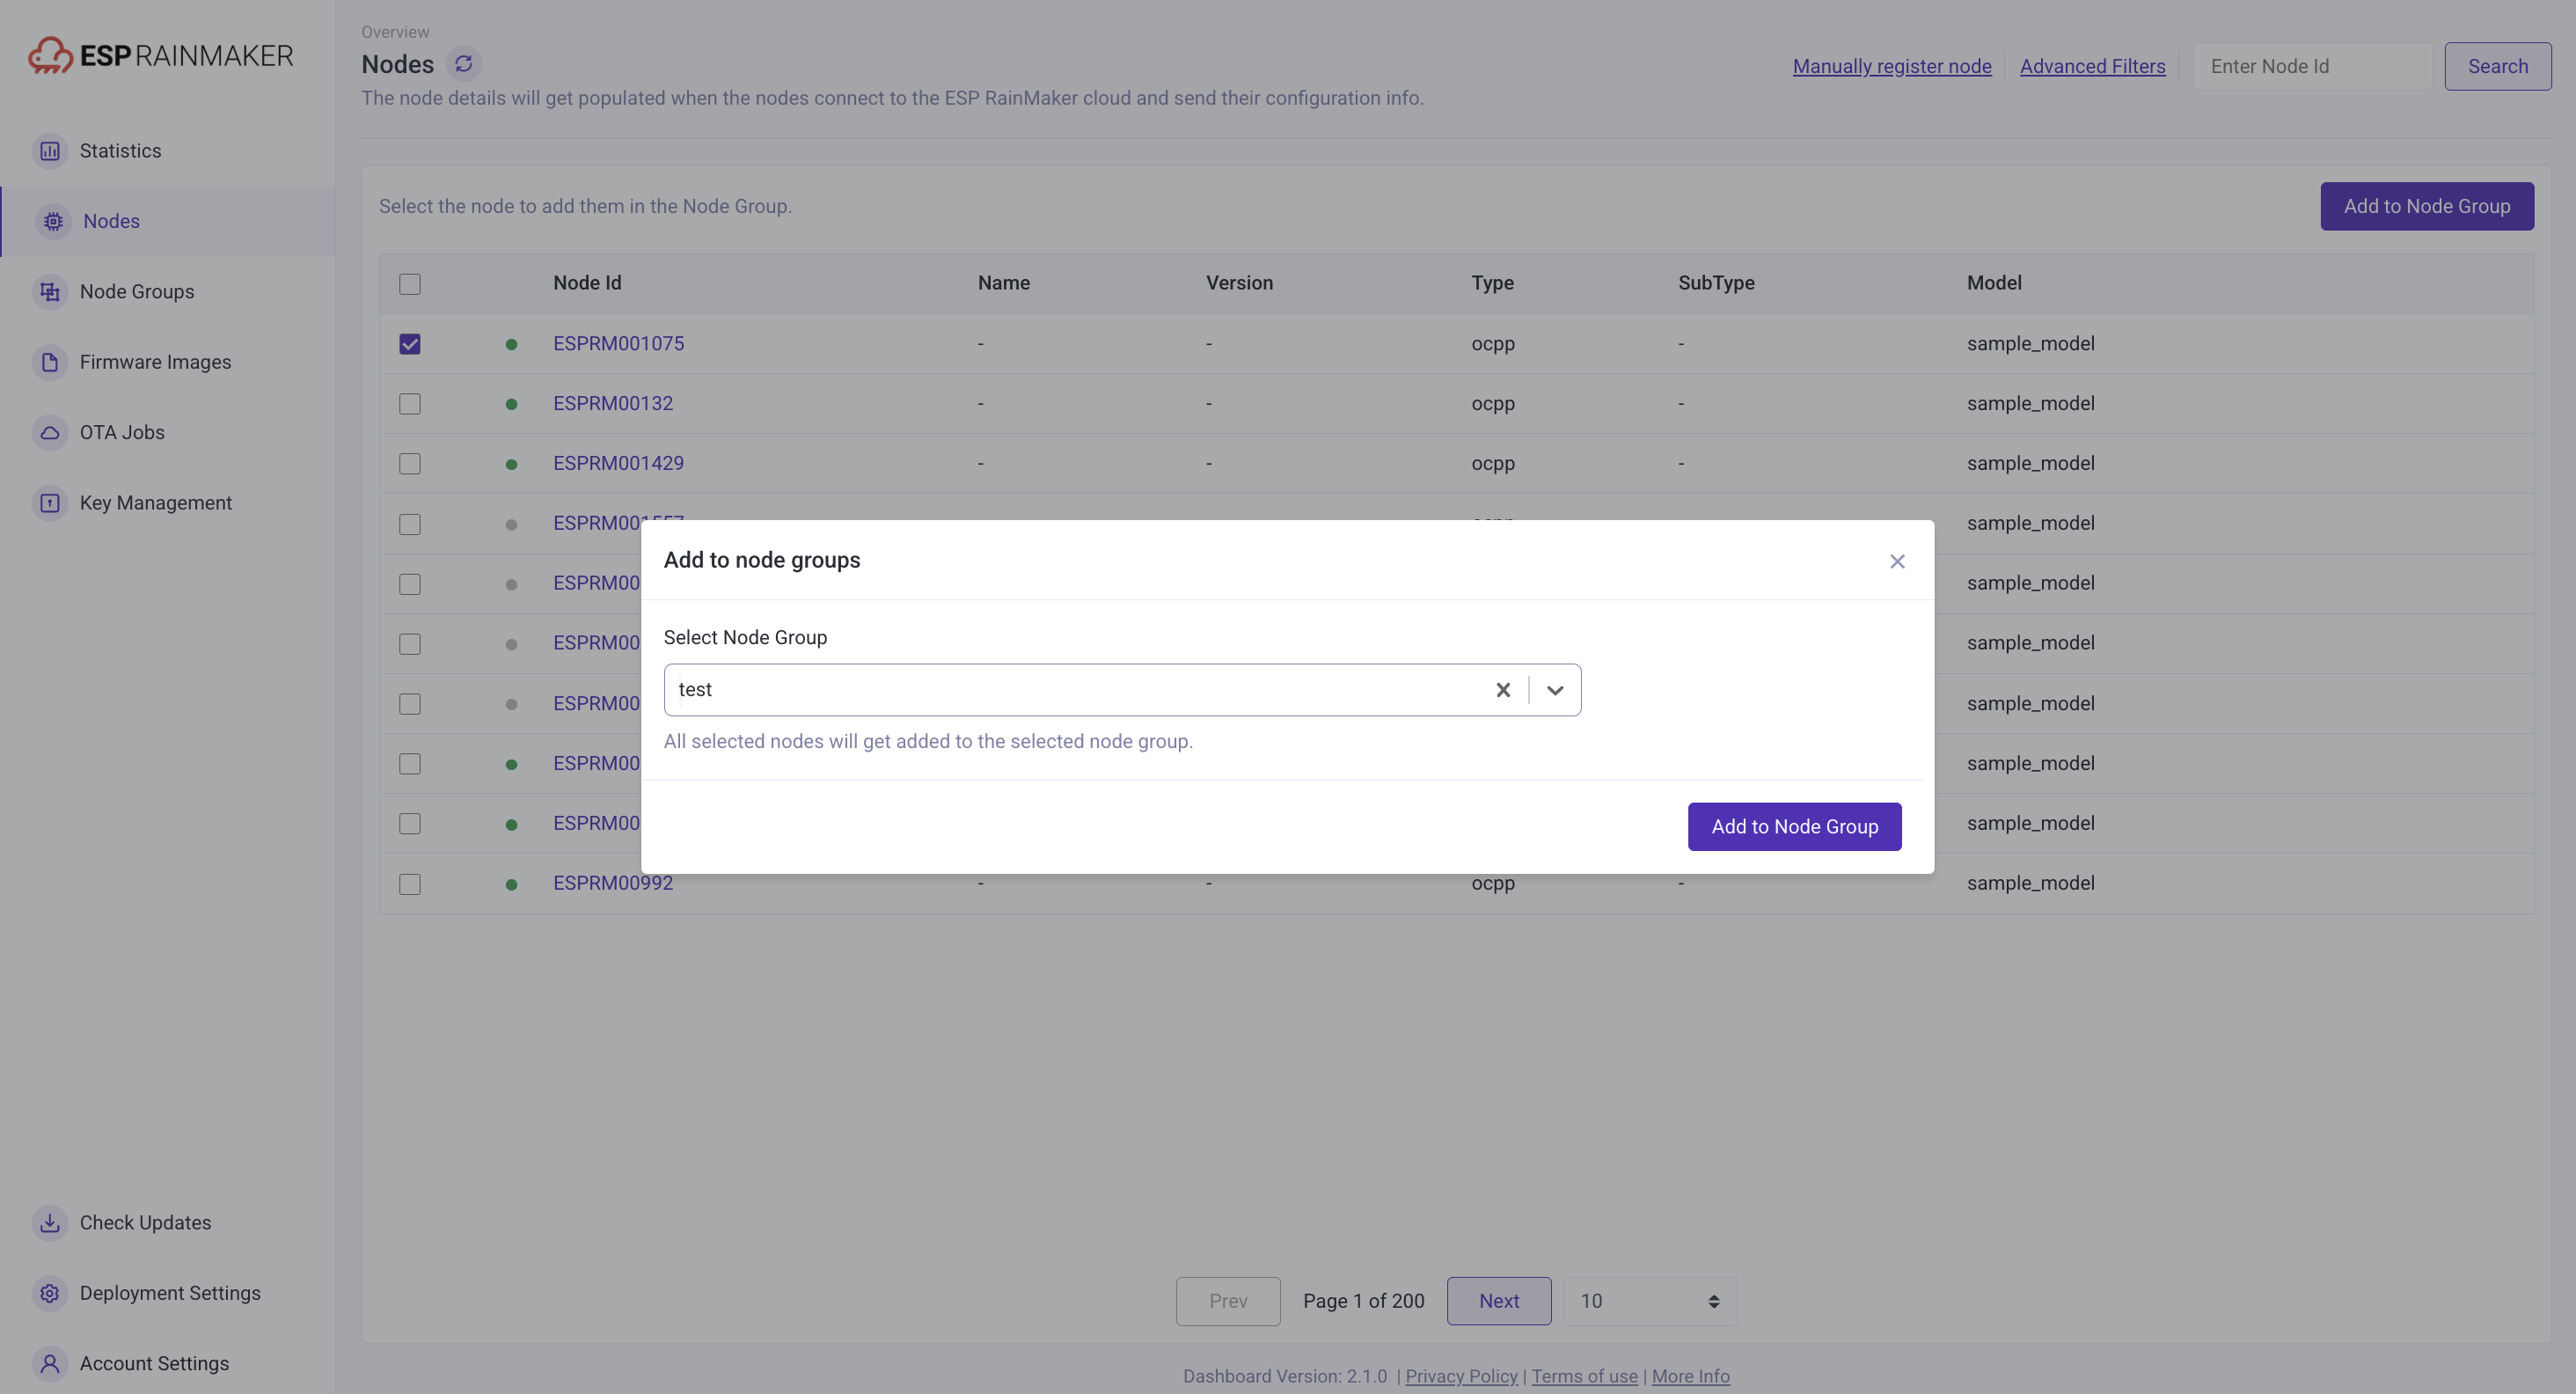 |