

6. Monitor the deployment
After you submit, ESP CloudHub runs the deployment and shows live progress. Stacks are deployed in waves based on their dependencies — independent stacks run in parallel; dependent stacks wait for the ones they rely on.
Watch progress
The Current Deployment view shows each stack and its status as the deployment proceeds (for example IN_PROGRESS).
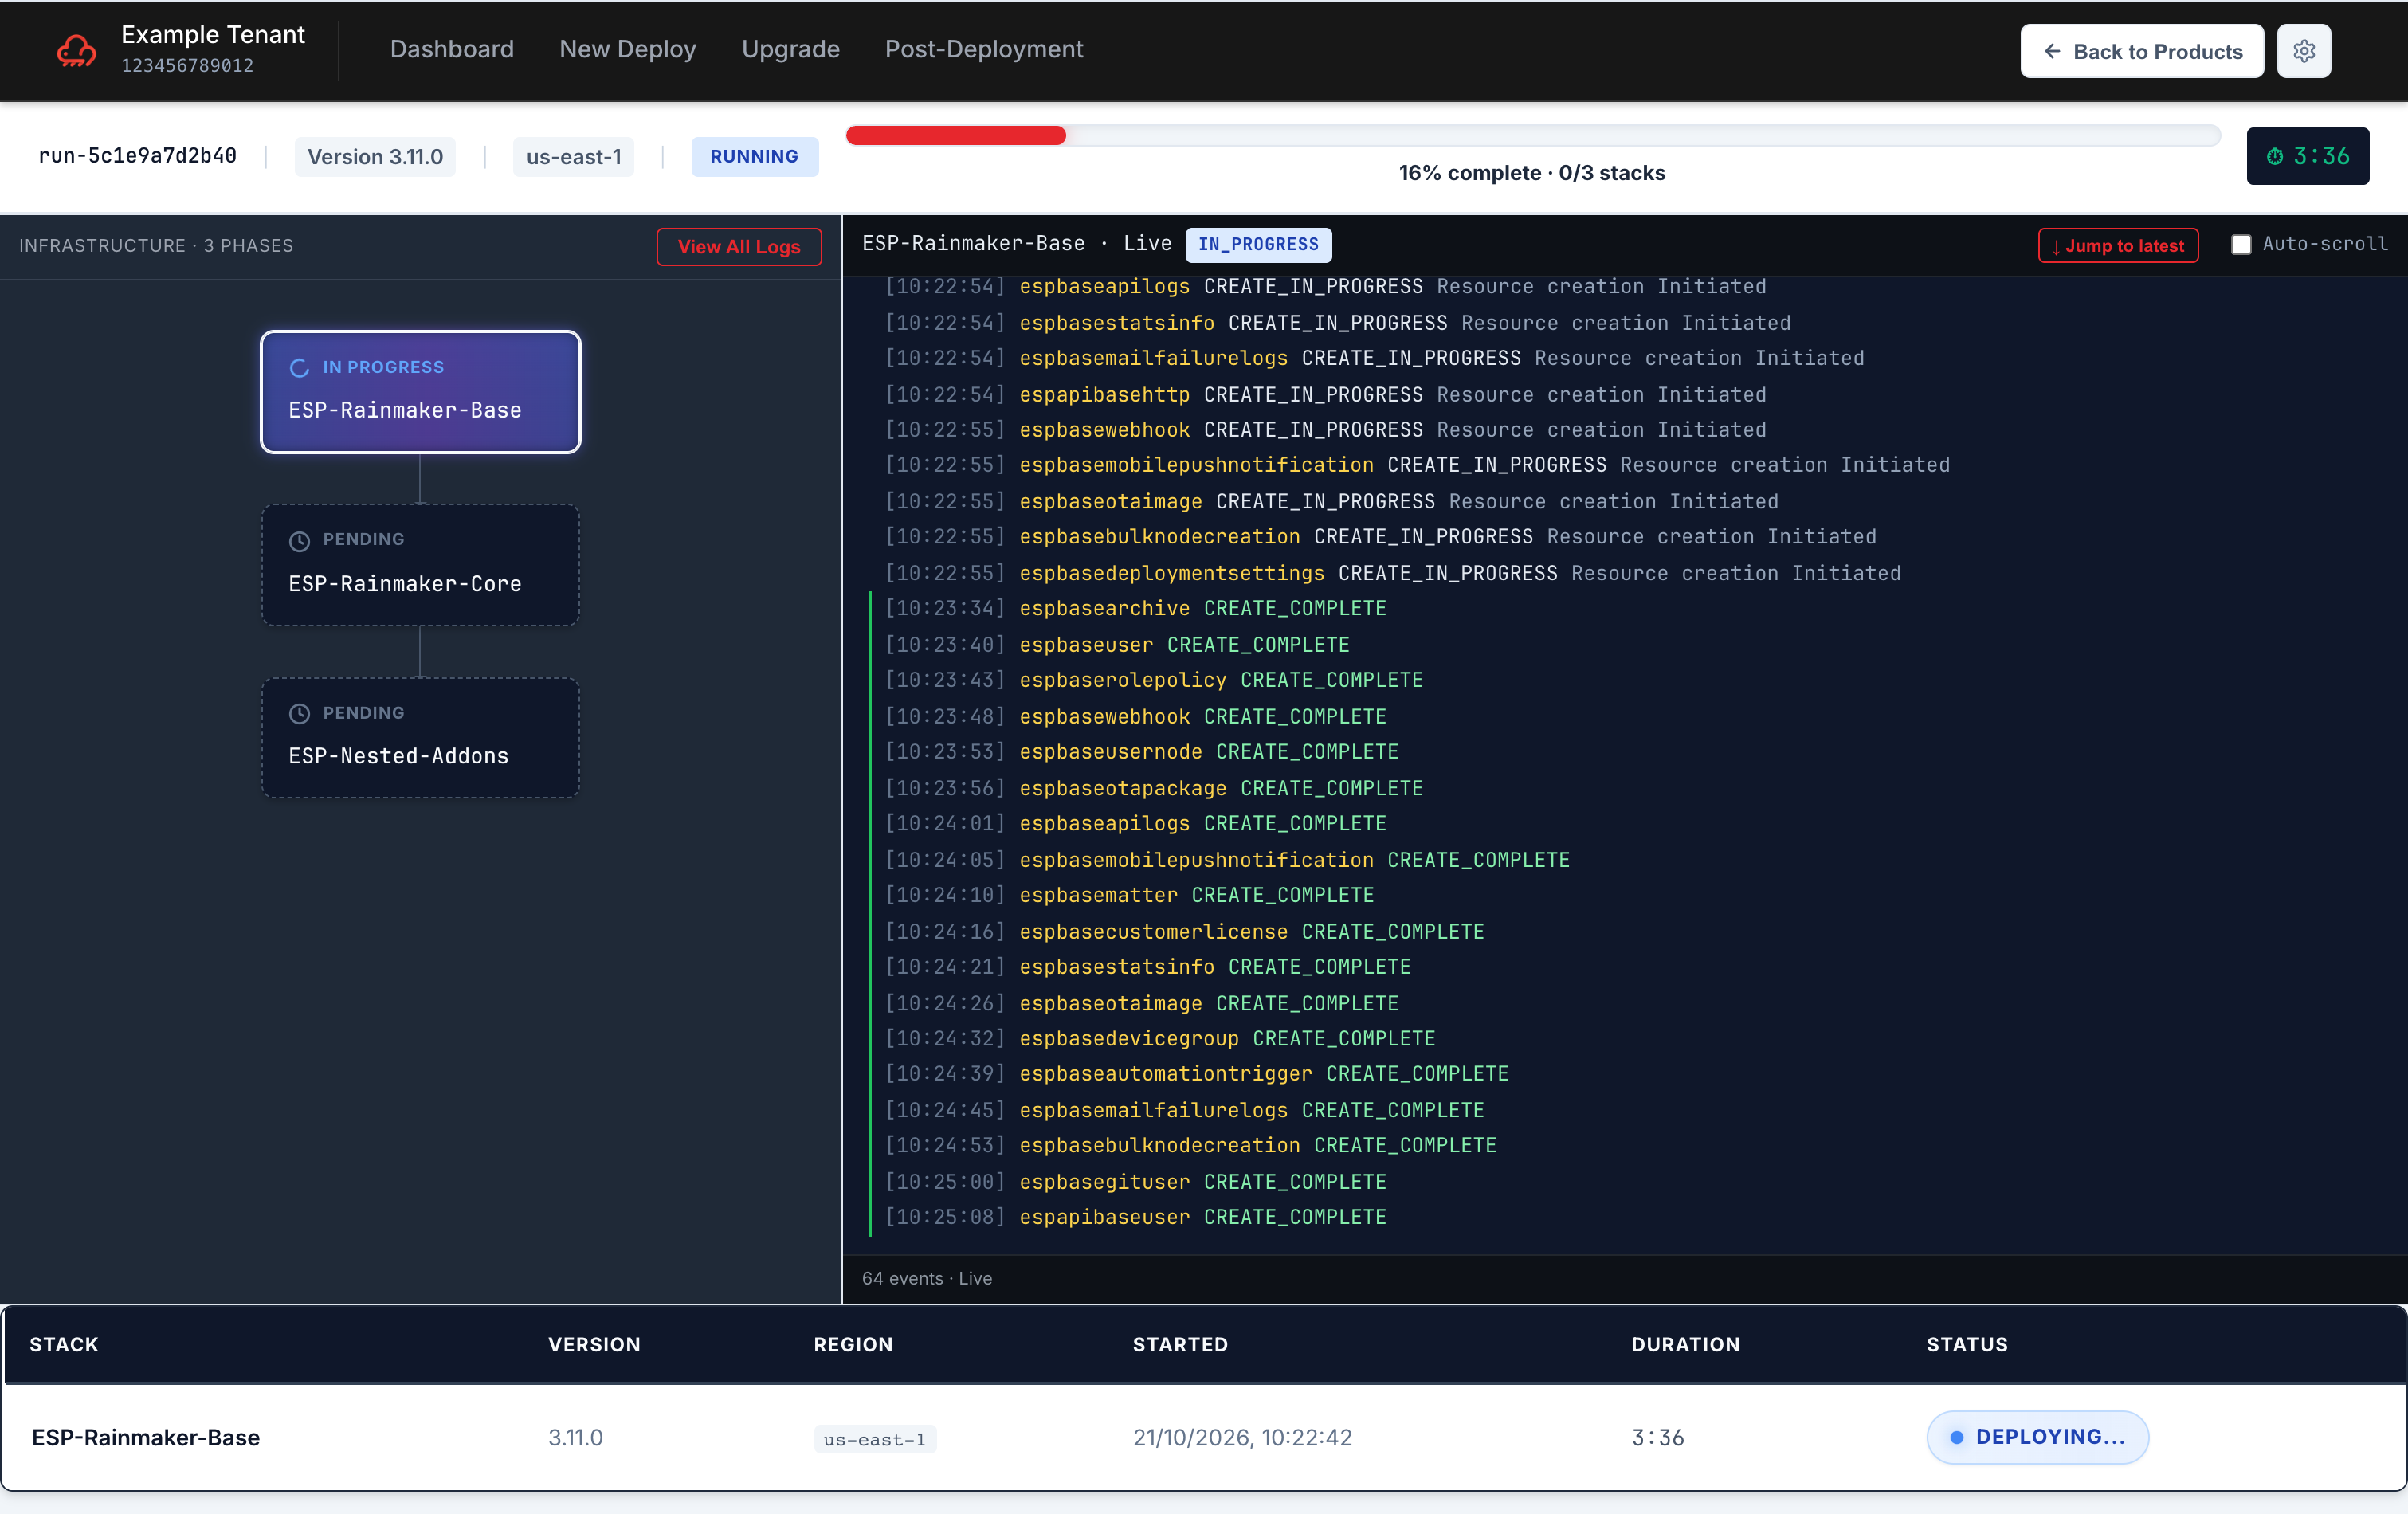
Leave this open while the deployment runs. You don't need to do anything — ESP CloudHub drives each wave automatically.
Completion
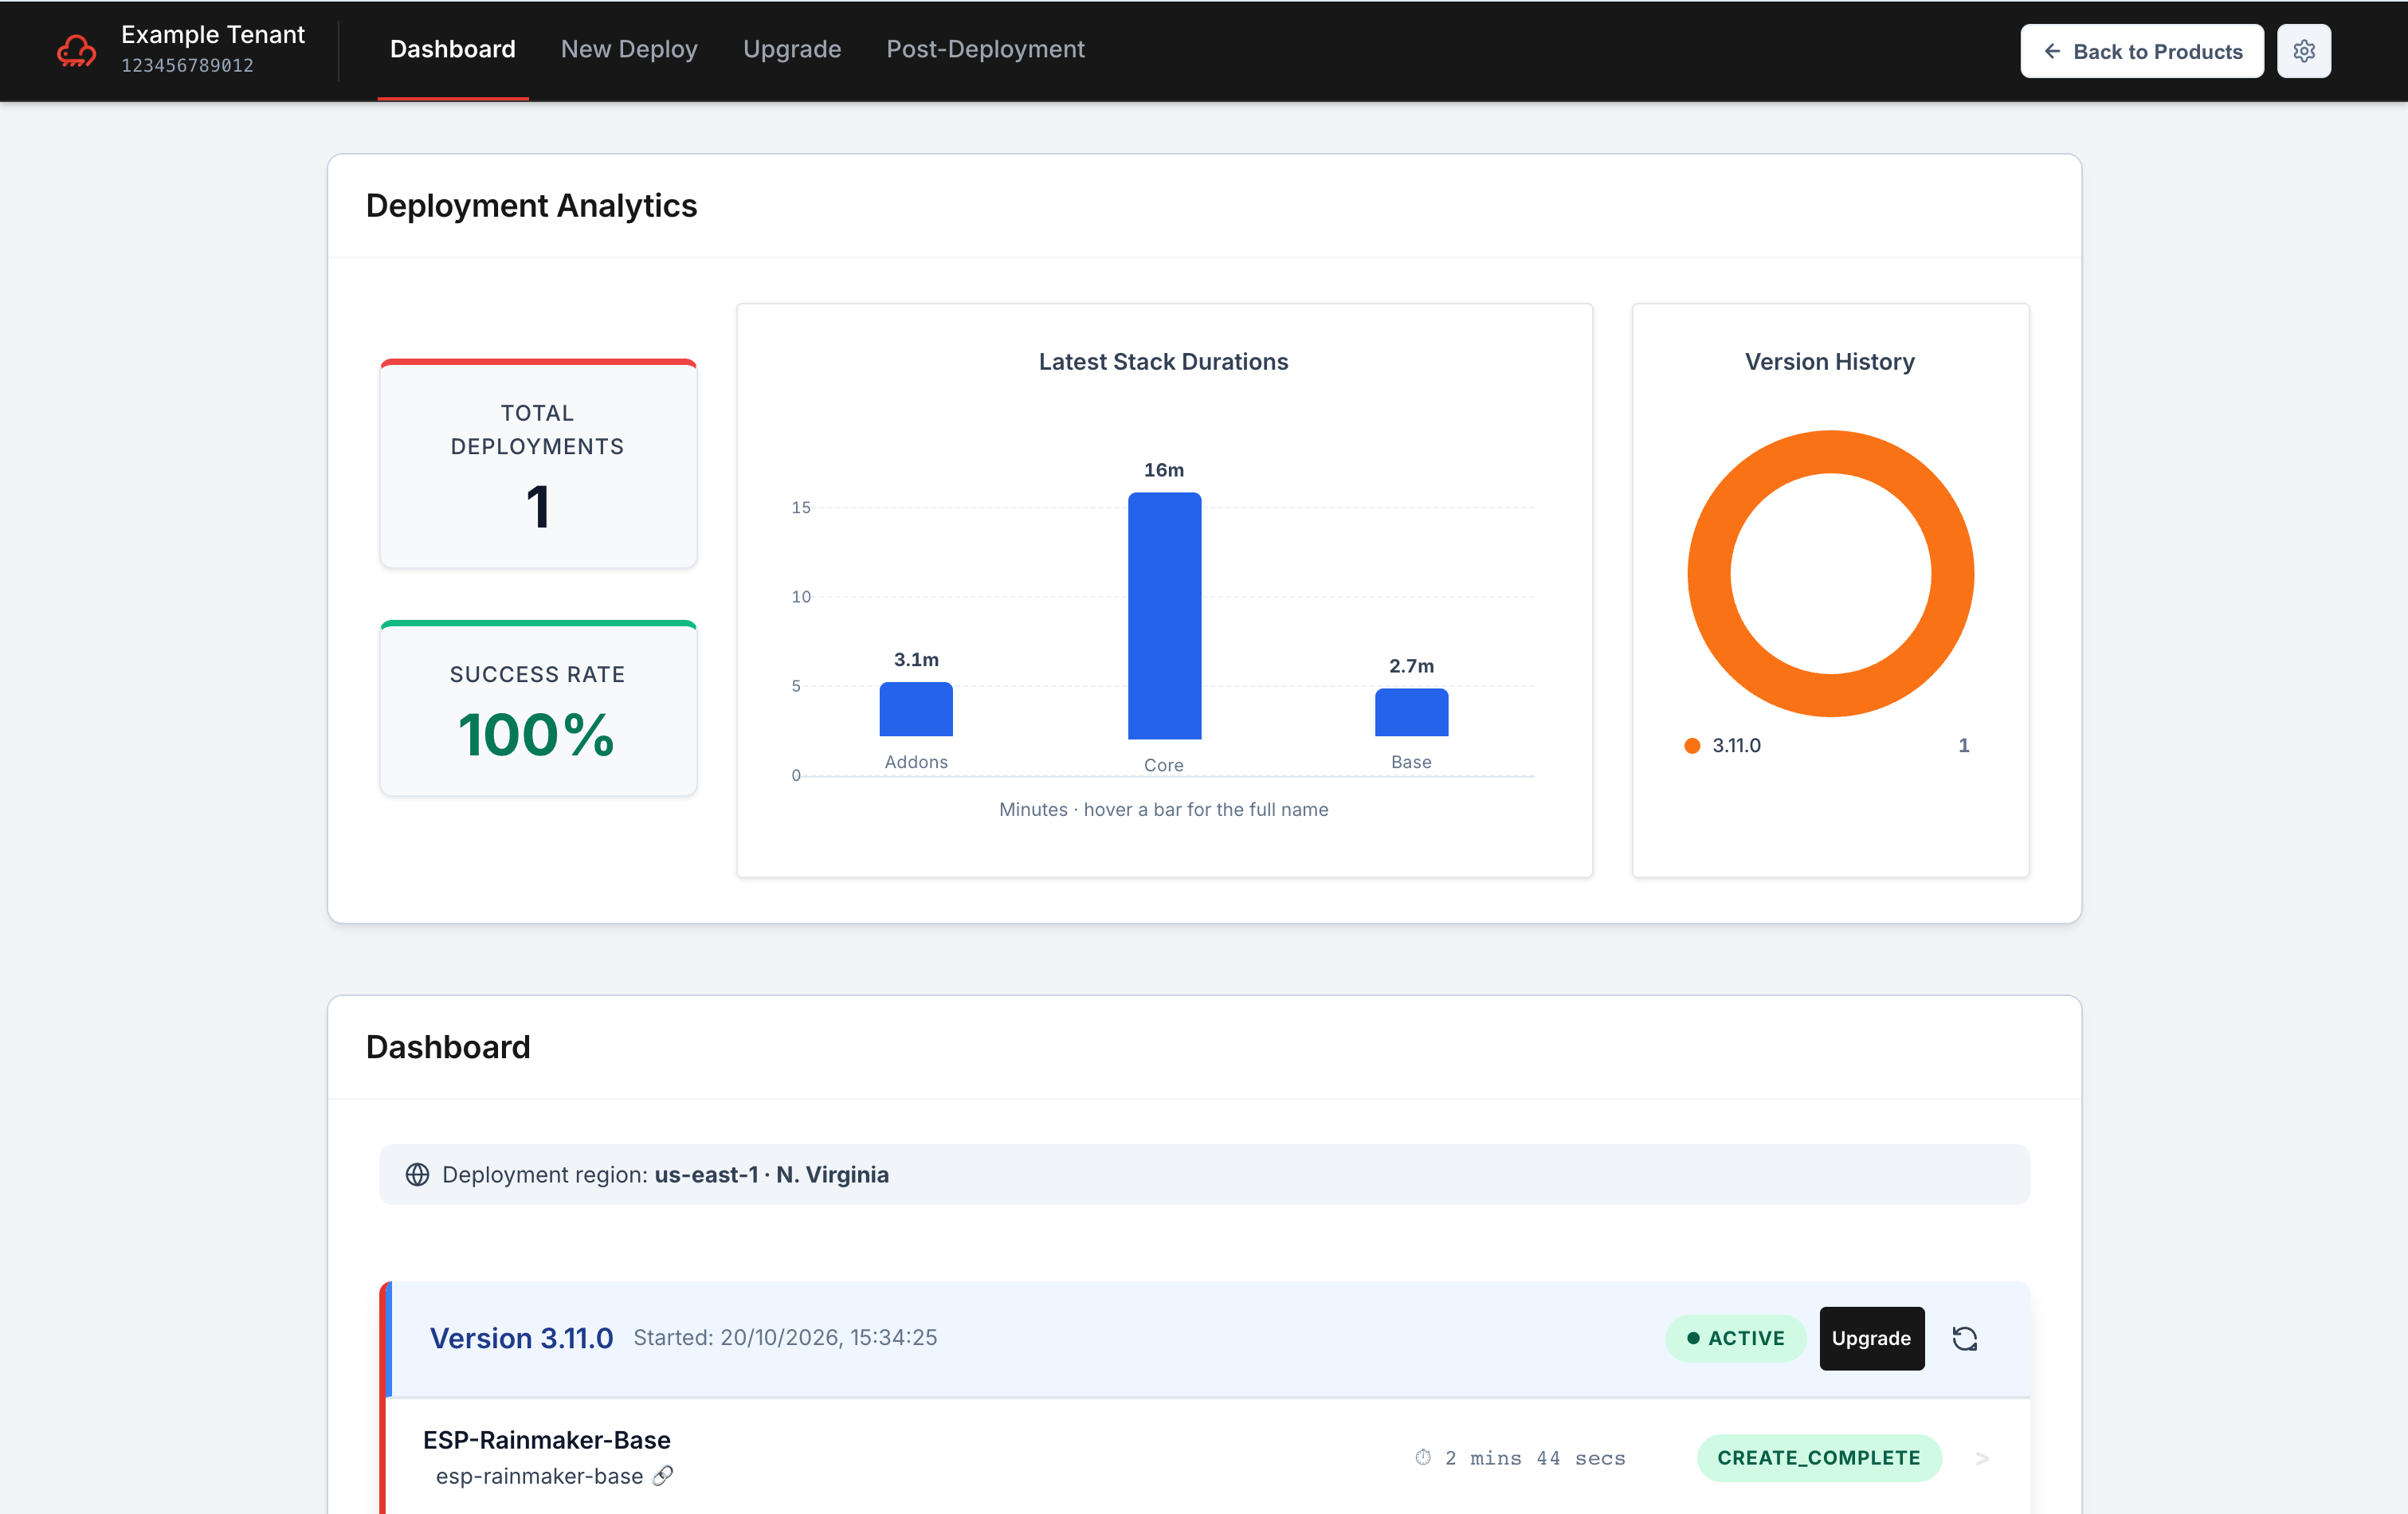
When every stack reaches CREATE_COMPLETE, the deployment is done and RainMaker is live in your tenant account.
Confirm you deployed exactly what you intended
Before moving on, check the completed deployment against what you selected:
- Every stack you chose is listed and shows a success status (e.g.
CREATE_COMPLETE). Nothing you selected should be missing. - The version shown matches the version you picked in the wizard.
- On the dashboard, the run appears with a green Active badge — this is your current, live deployment.
- Open any stack to review its details (parameters, last-updated time) and confirm the values are the ones you entered — see Inspect a stack below.
If anything looks different from what you configured — a missing stack, a wrong version, or an unexpected parameter — treat it as a problem to resolve before you rely on the deployment.
Inspect a stack: configuration, outputs and tags
The deployment is not finished when the stacks go green — you still need the values the stacks produced. Endpoints, resource names and IDs that the rest of your setup depends on are published as CloudFormation outputs, and the dashboard shows them without you having to open the AWS console.
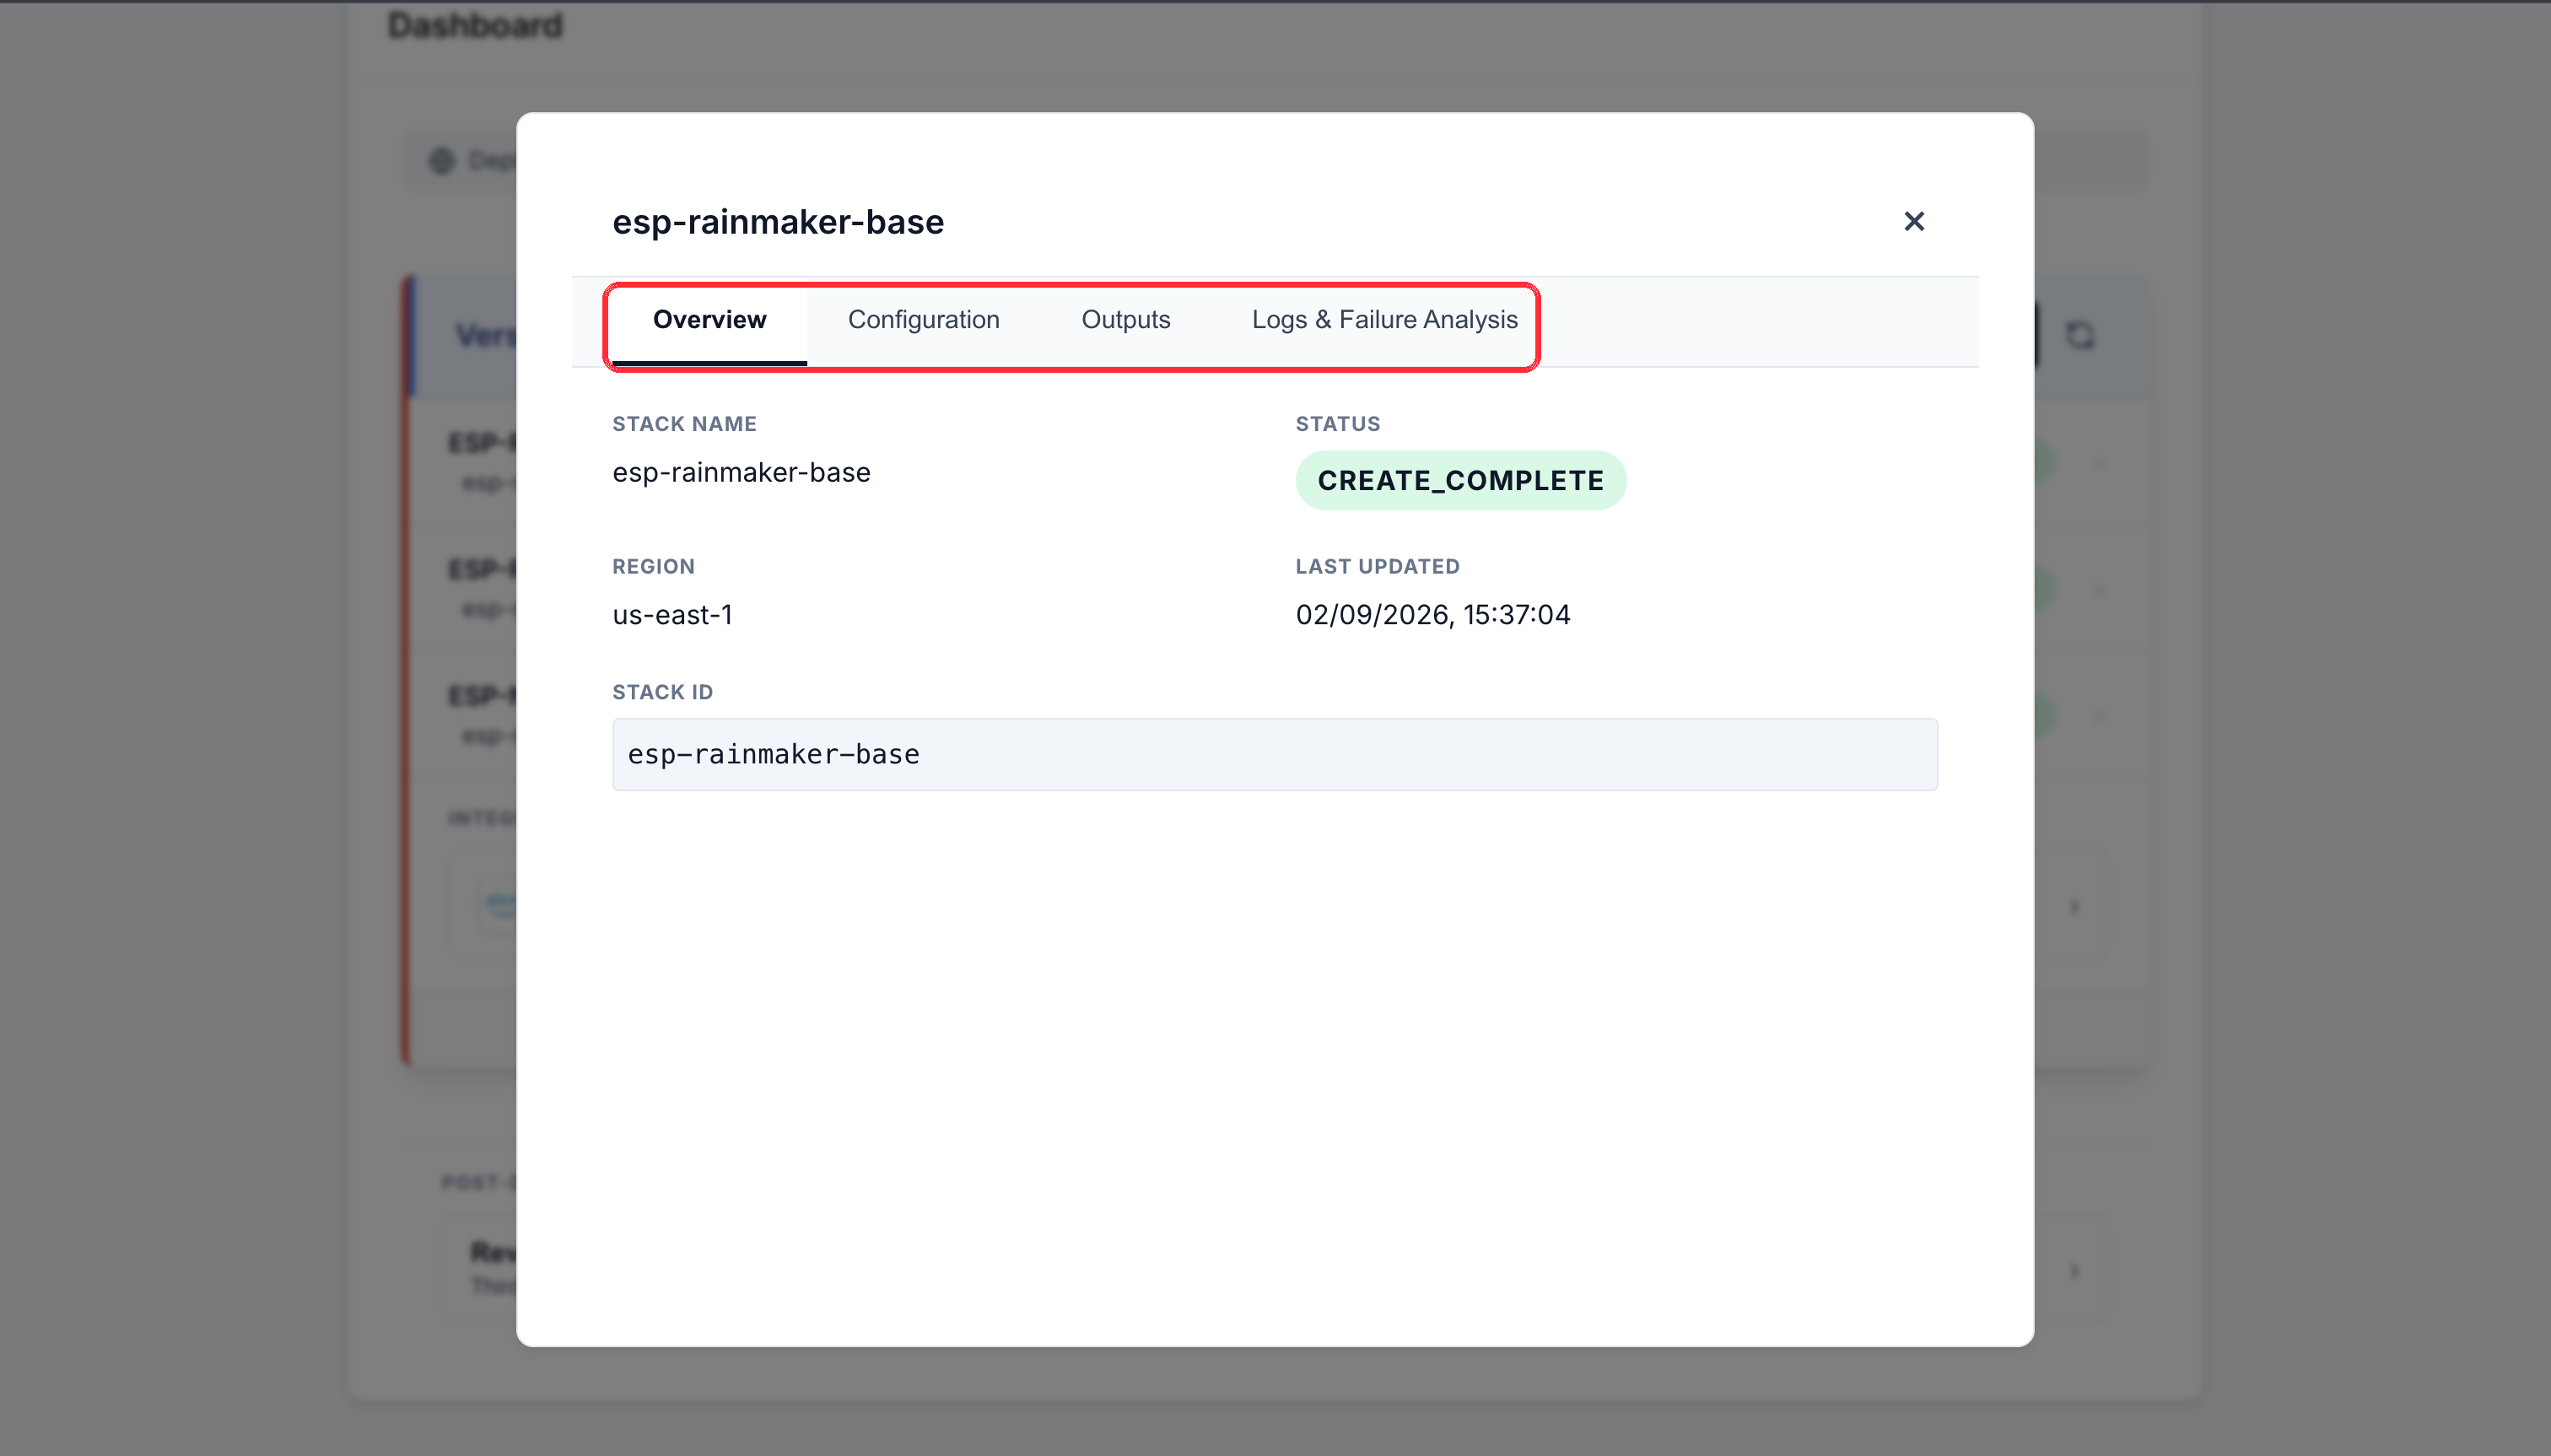
On the dashboard, click any stack row in the completed run to open its details. Four tabs:
| Tab | What it gives you |
|---|---|
| Overview | Stack name, status, region, last-updated time and stack ID |
| Configuration | The CloudFormation parameters this stack was deployed with, and its Tags |
| Outputs | The stack's outputs — key, value, source and description |
| Logs & Failure Analysis | Events, and the reason a stack failed |
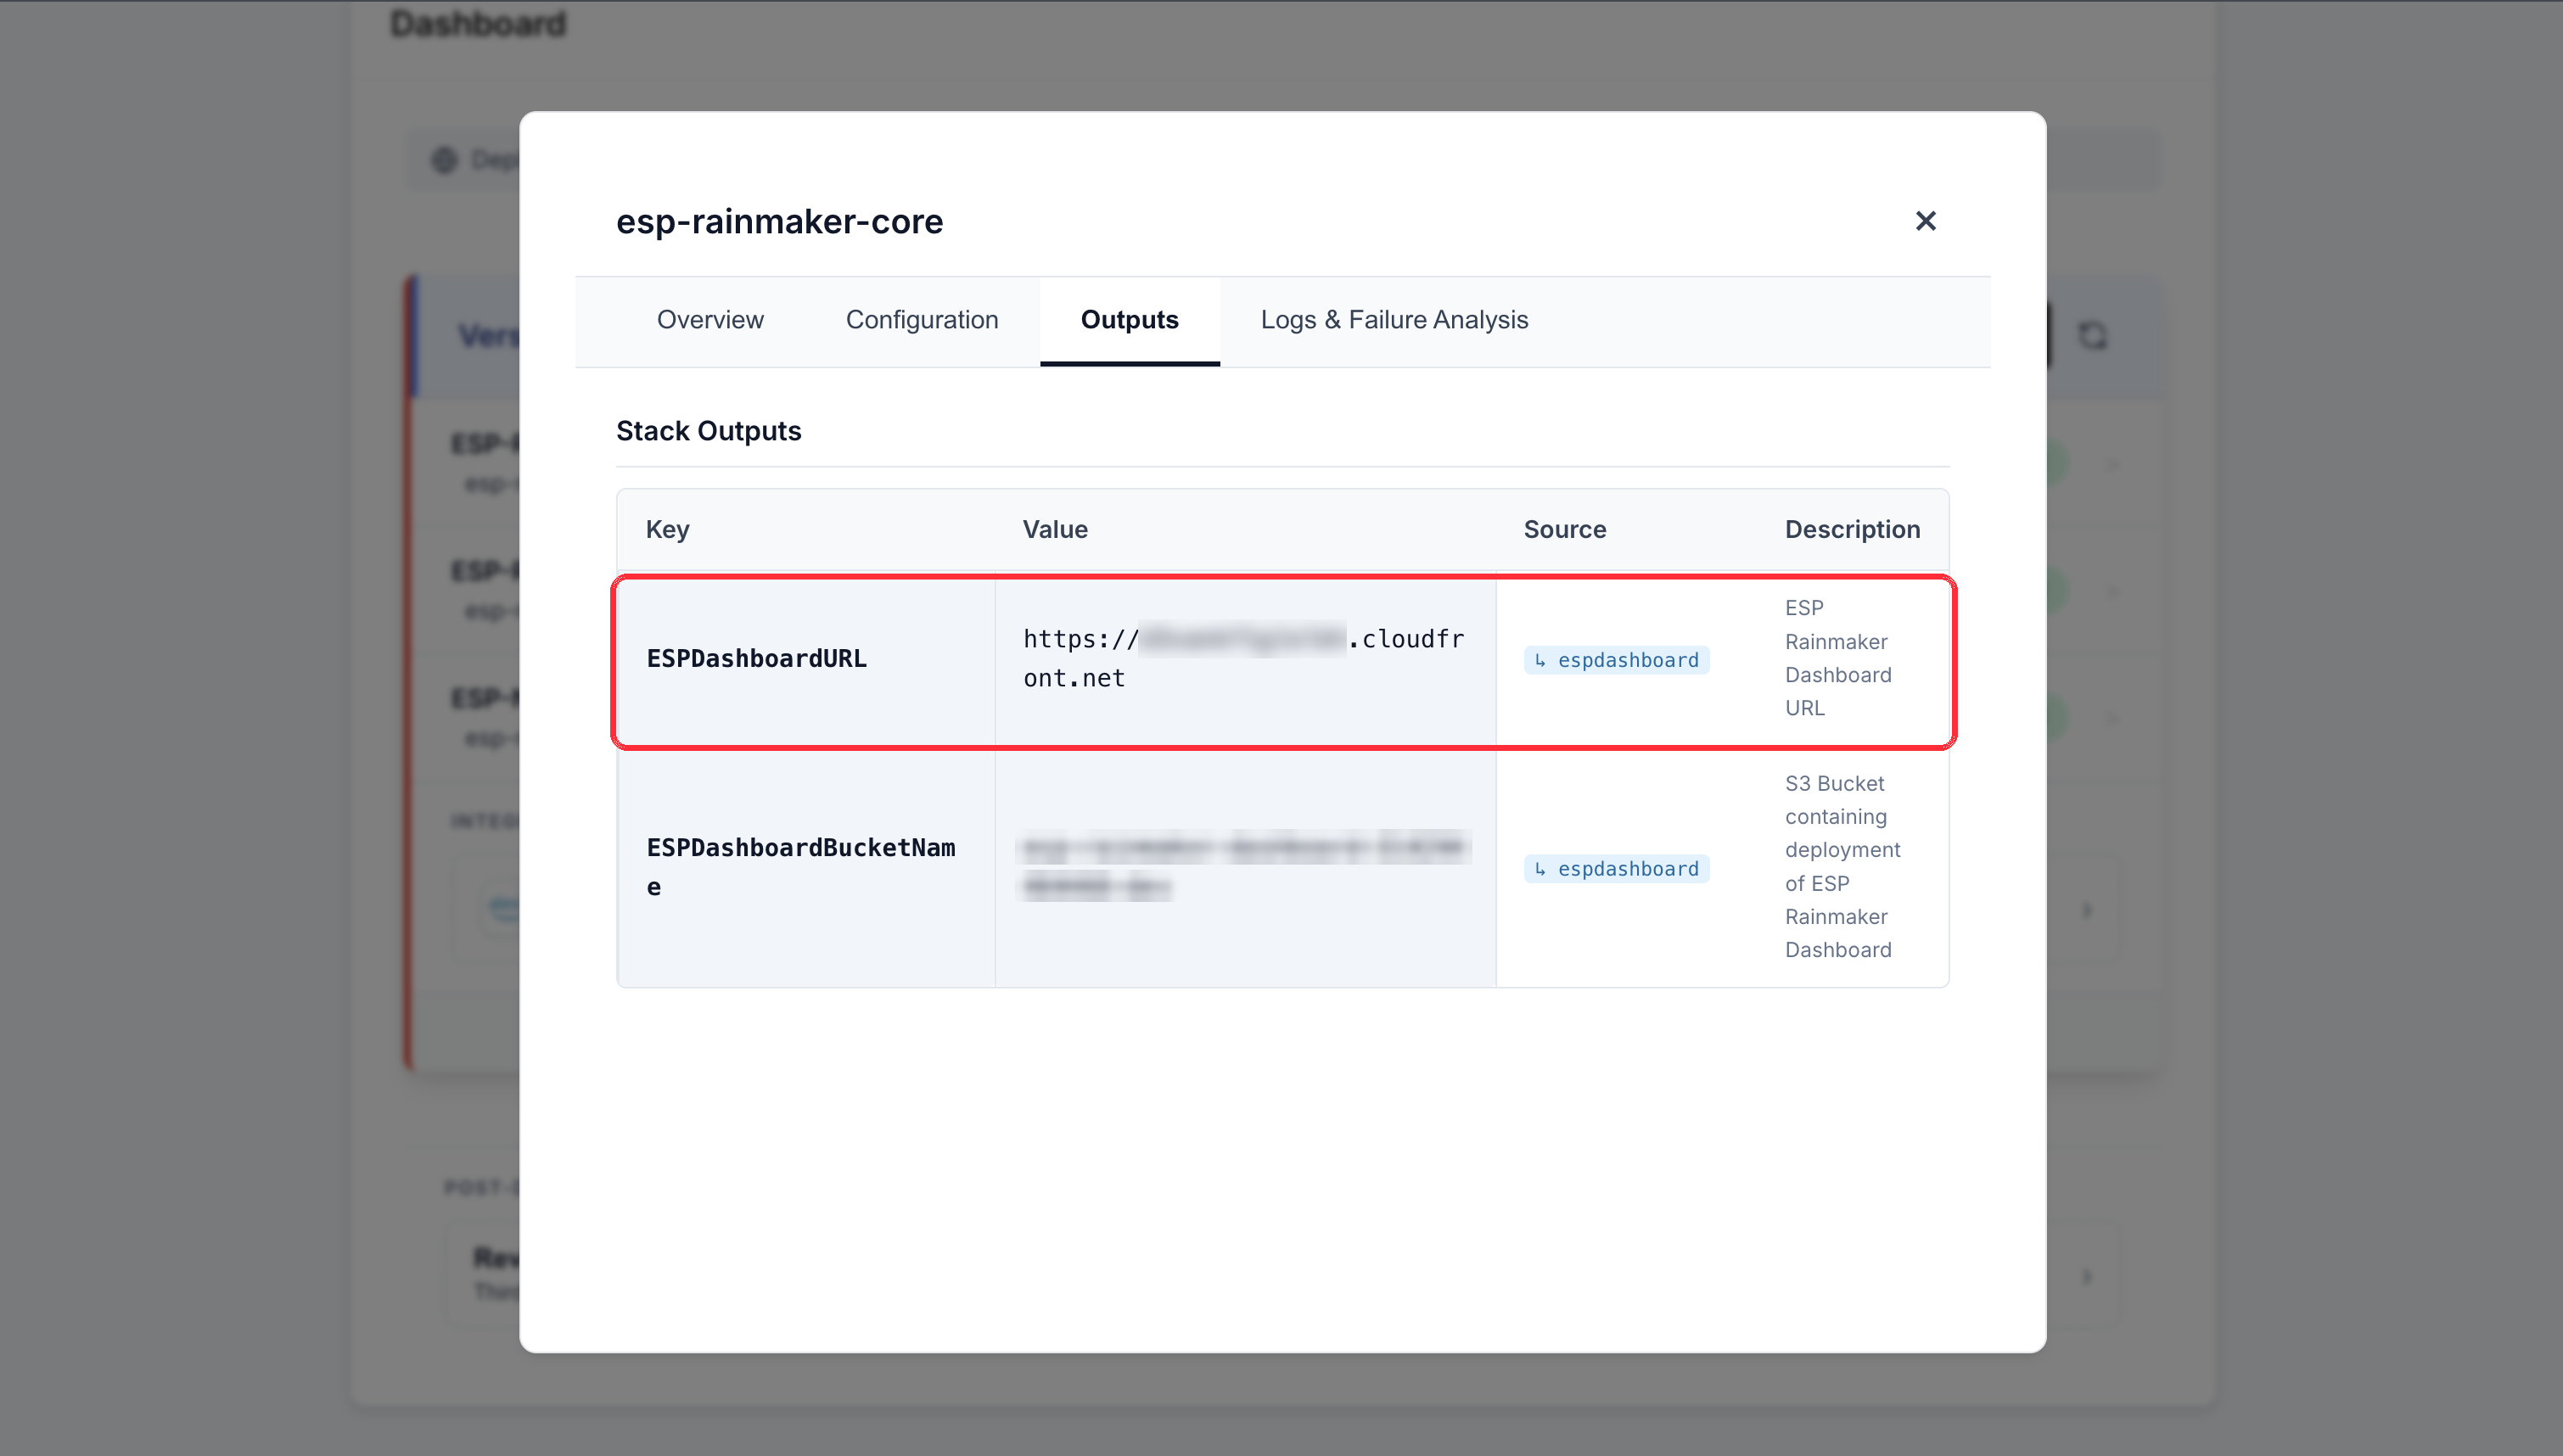
Take a copy of the outputs you need before moving on — these are the values you hand to
firmware, apps, and any integration that talks to this deployment. ESPDashboardURL is the
address of your RainMaker dashboard itself, which you will need for
post-deployment configuration.
Check the version shown for the deployment on the dashboard. ESP CloudHub reads it from the deployed CloudFormation templates, so it stays correct even if a stack is later upgraded outside ESP CloudHub. Don't rely on stack Tags for this: they can be edited, and an upgrade done in the AWS console does not update them.
If a stack reports a failure, the deployment stops at that stack. Open the failing stack to read its status reason, fix the underlying cause (often a parameter value or an AWS quota), and retry. See Troubleshooting for common causes.
Next steps
- Post-deployment configuration — social sign-in and push notifications. Do this next: the deployment isn't usable by end users until it's done.
- Want voice control for your devices? See Integrate Alexa & voice assistants.
- When a newer version is released, see Upgrade the deployment.