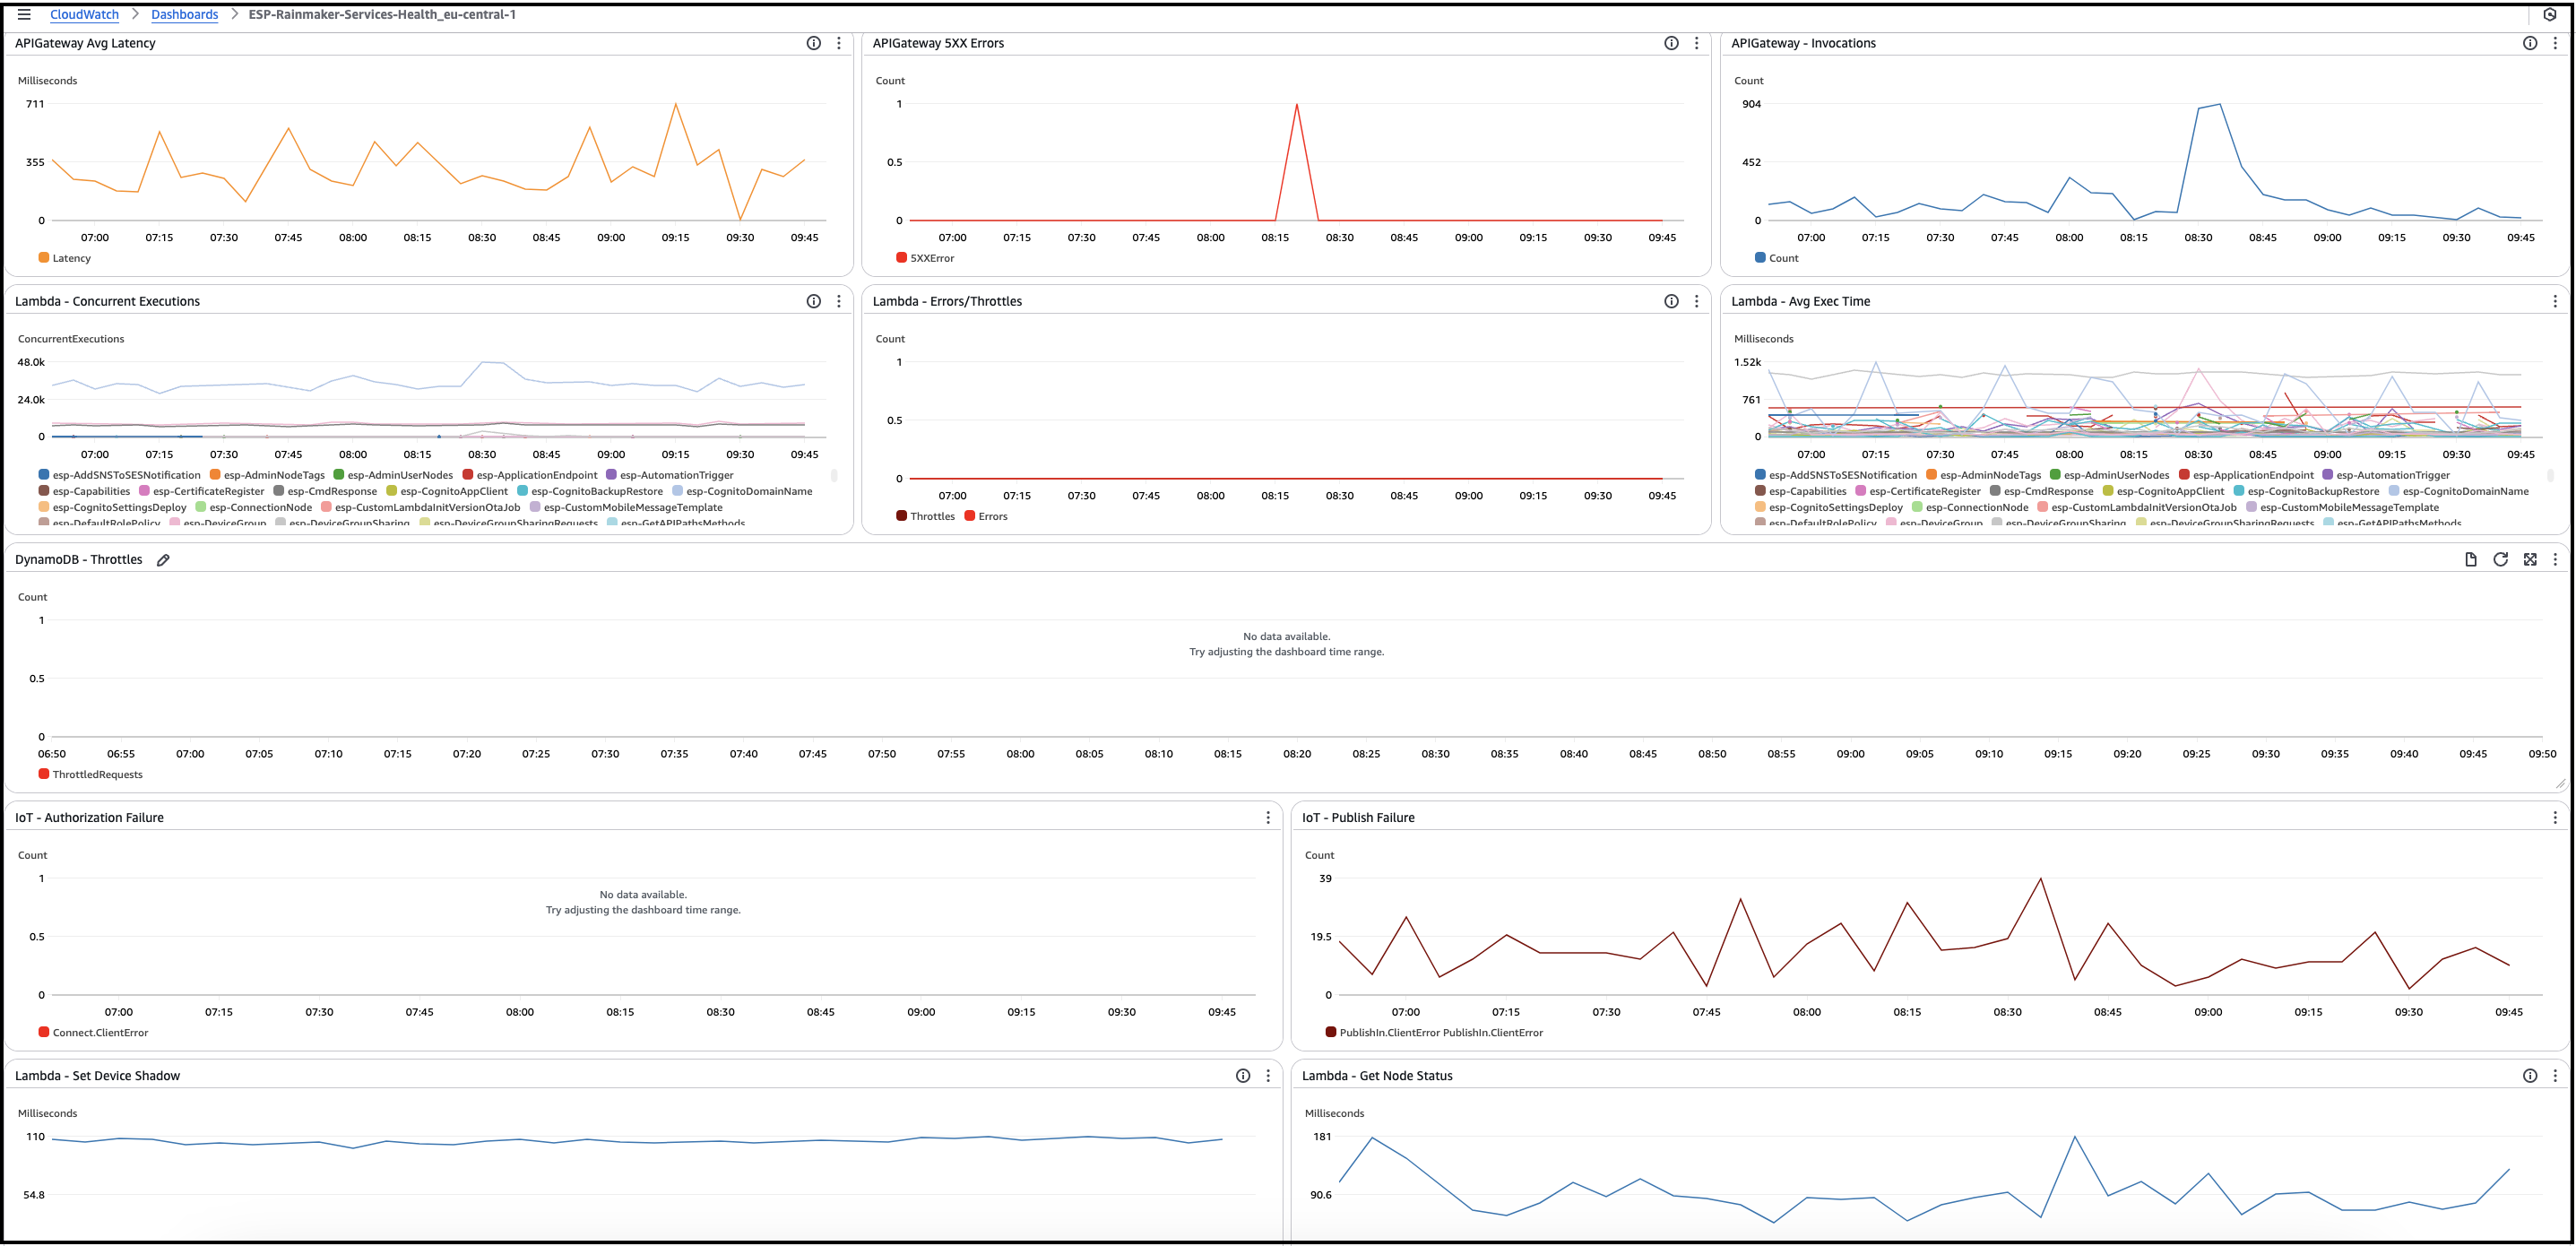
RainMaker Monitoring Dashboard
Rainmaker CloudWatch Dashboard is a monitoring tool for various Rainmaker AWS Service Metrics such as Lambda invocation/throttling count, API gateway call count, API gateway error count, etc. It shows all these metrics at one place in AWS CloudWatch console > Dashboards > ESP-Rainmaker-Services-Health.
These metrics are provided by AWS and visualized by Rainmaker in a unified dashboard. Each graph in the dashboard is called a widget. The aggregation type of each metric is specific to what needs to be shown on the graph.
The dashboard is visible across all regions within the AWS account, but it only displays metrics from the specific region where the deployment was performed. This region is also indicated in the dashboard's name.
The X and Y-axis are labeled about the information that they show.
