Debug Node Connection Issues
This guide covers common RainMaker node connection issues and their debugging from the cloud side.
Node lifecycle error codes
The table below lists the various disconnect reasons that can occur when a node loses connection to the cloud:
| Disconnect Reason | Description |
|---|---|
| AUTH_ERROR | The client failed to authenticate or authorization failed. |
| CLIENT_INITIATED_DISCONNECT | The client indicates that it will disconnect. The client can do this by sending either a MQTT DISCONNECT control packet or a Close frame if the client is using a WebSocket connection. |
| CLIENT_ERROR | The client did something wrong that causes it to disconnect. For example, a client will be disconnected for sending more than 1 MQTT CONNECT packet on the same connection or if the client attempts to publish with a payload that exceeds the payload limit. |
| CONNECTION_LOST | The client-server connection is cut off. This can happen during a period of high network latency or when the internet connection is lost. |
| DUPLICATE_CLIENTID | The client is using a client ID that is already in use. In this case, the client that is already connected will be substituted with this disconnect reason. |
| FORBIDDEN_ACCESS | The client is not allowed to be connected. For example, a client with a denied IP address will fail to connect. |
| MQTT_KEEP_ALIVE_TIMEOUT | If there is no client-server communication for 1.5x of the client's keep-alive time, the client is disconnected. |
| SERVER_ERROR | Disconnected due to unexpected server issues. |
| SERVER_INITIATED_DISCONNECT | Server intentionally disconnects a client for operational reasons. |
| THROTTLED | The client is disconnected for exceeding a throttling limit. |
| WEBSOCKET_TTL_EXPIRATION | The client is disconnected because a WebSocket has been connected longer than its time-to-live value. |
| CUSTOMAUTH_TTL_EXPIRATION | The client is disconnected because it has been connected longer than the time-to-live value of its custom authorizer. |
Viewing Node Connection Logs
To check the node connection logs, you can use AWS CloudWatch. All connection-related logs for active nodes are stored in a specific log group.
Follow these steps to view the node connection logs:
- Sign in to the AWS Management Console.
- Navigate to the CloudWatch service.
- In the left navigation pane, click on Logs > Log Management.
- Search for the log group named
/aws/lambda/esp-ConnectionNode.
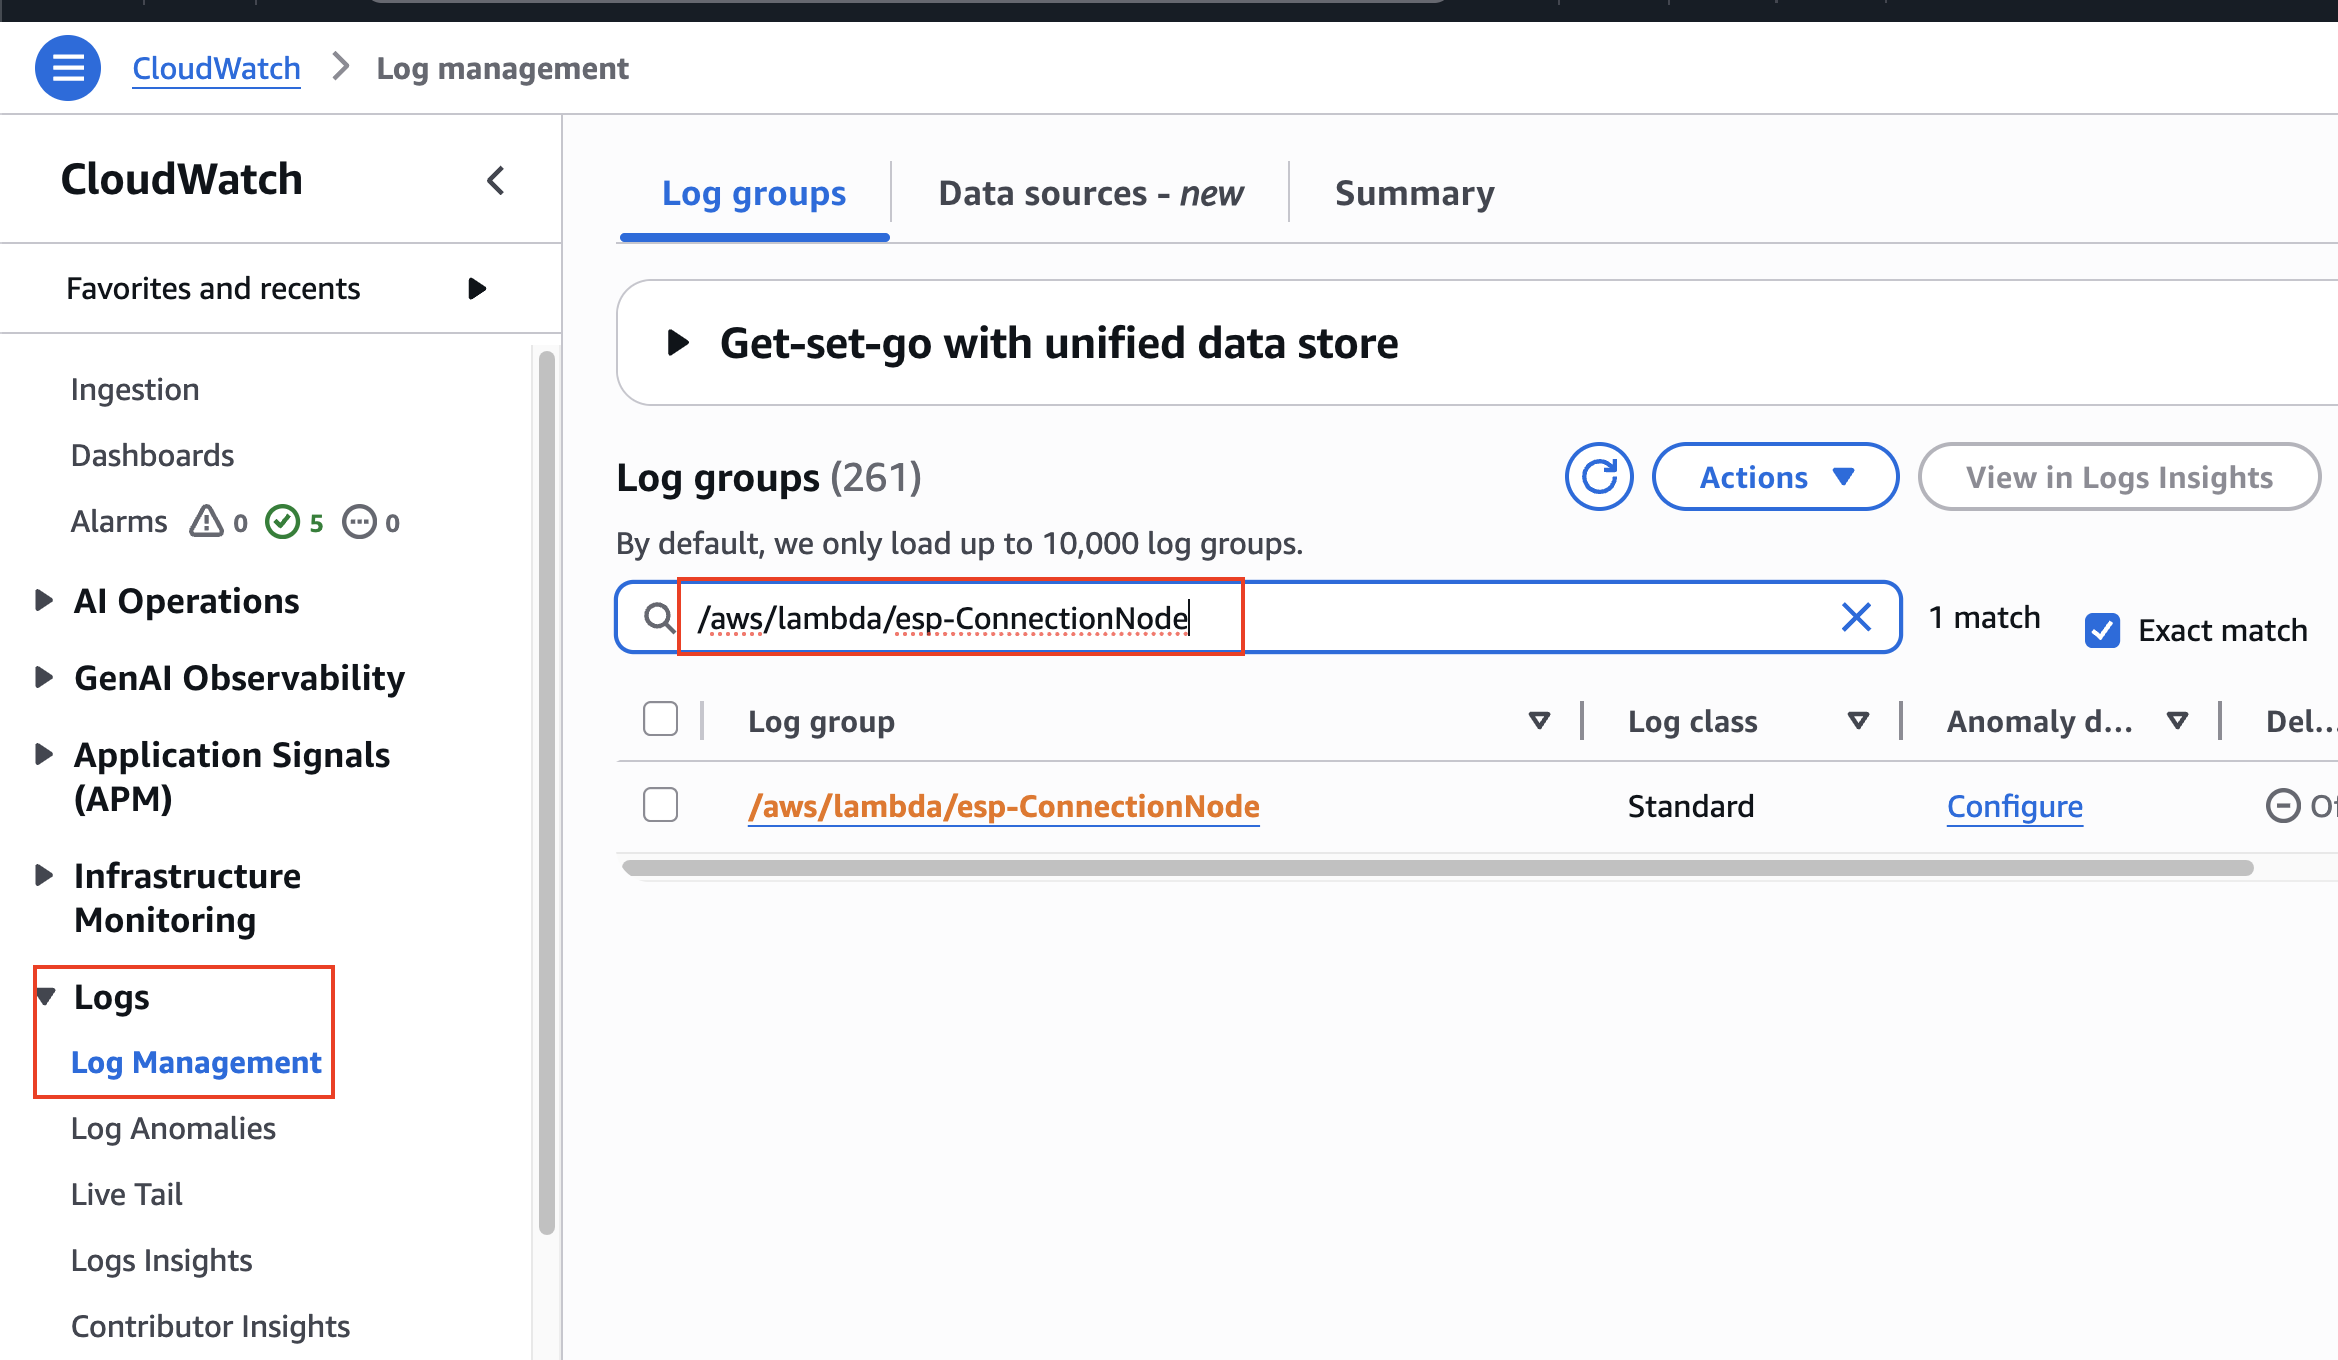
- Click on the log group to view all logs related to active node connections.
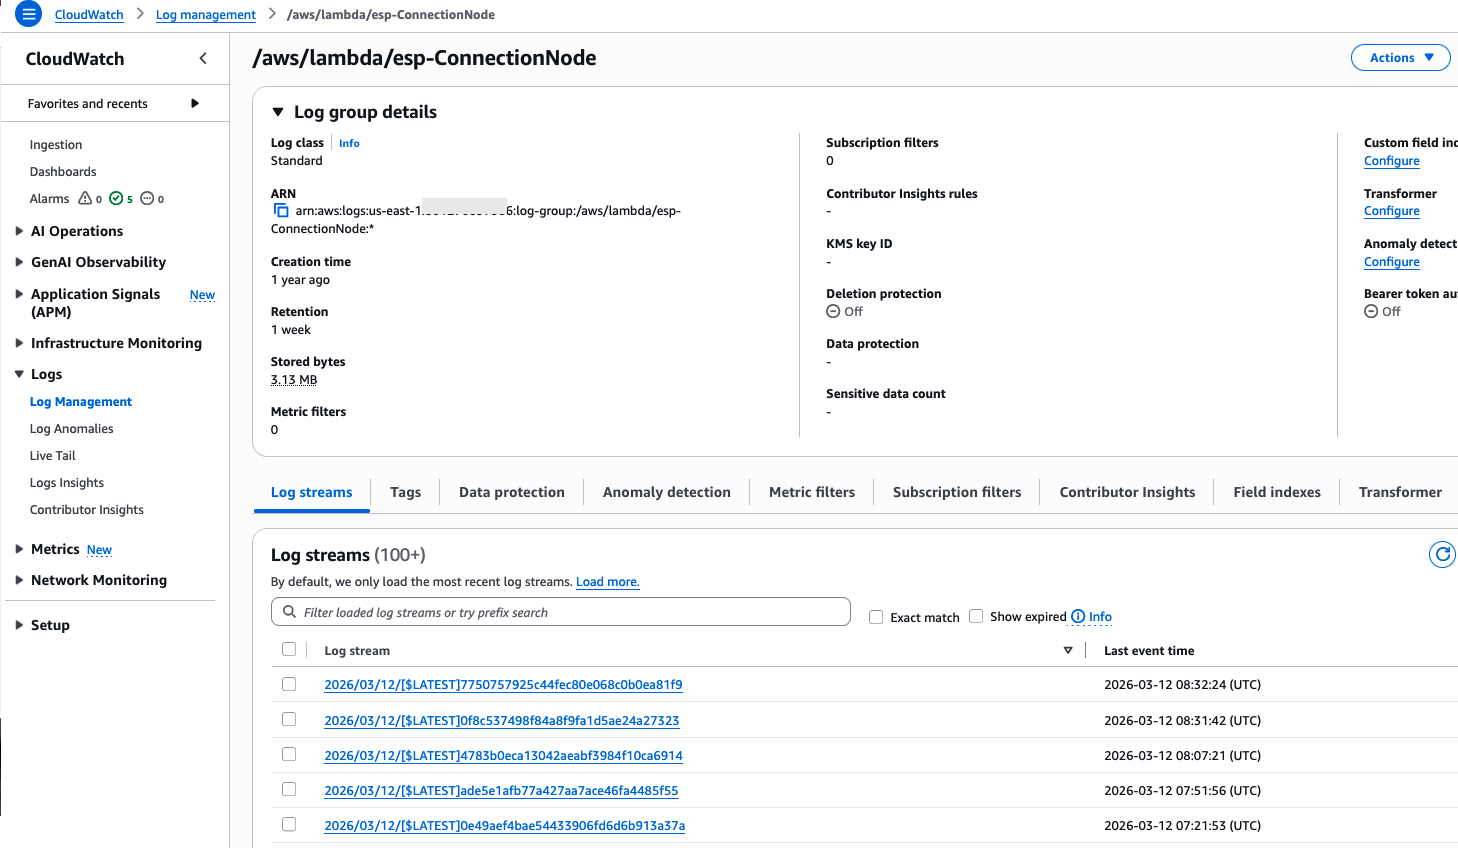
This log group contains connection events for all active nodes in your deployment.
Debugging a Specific Node's Connection Logs
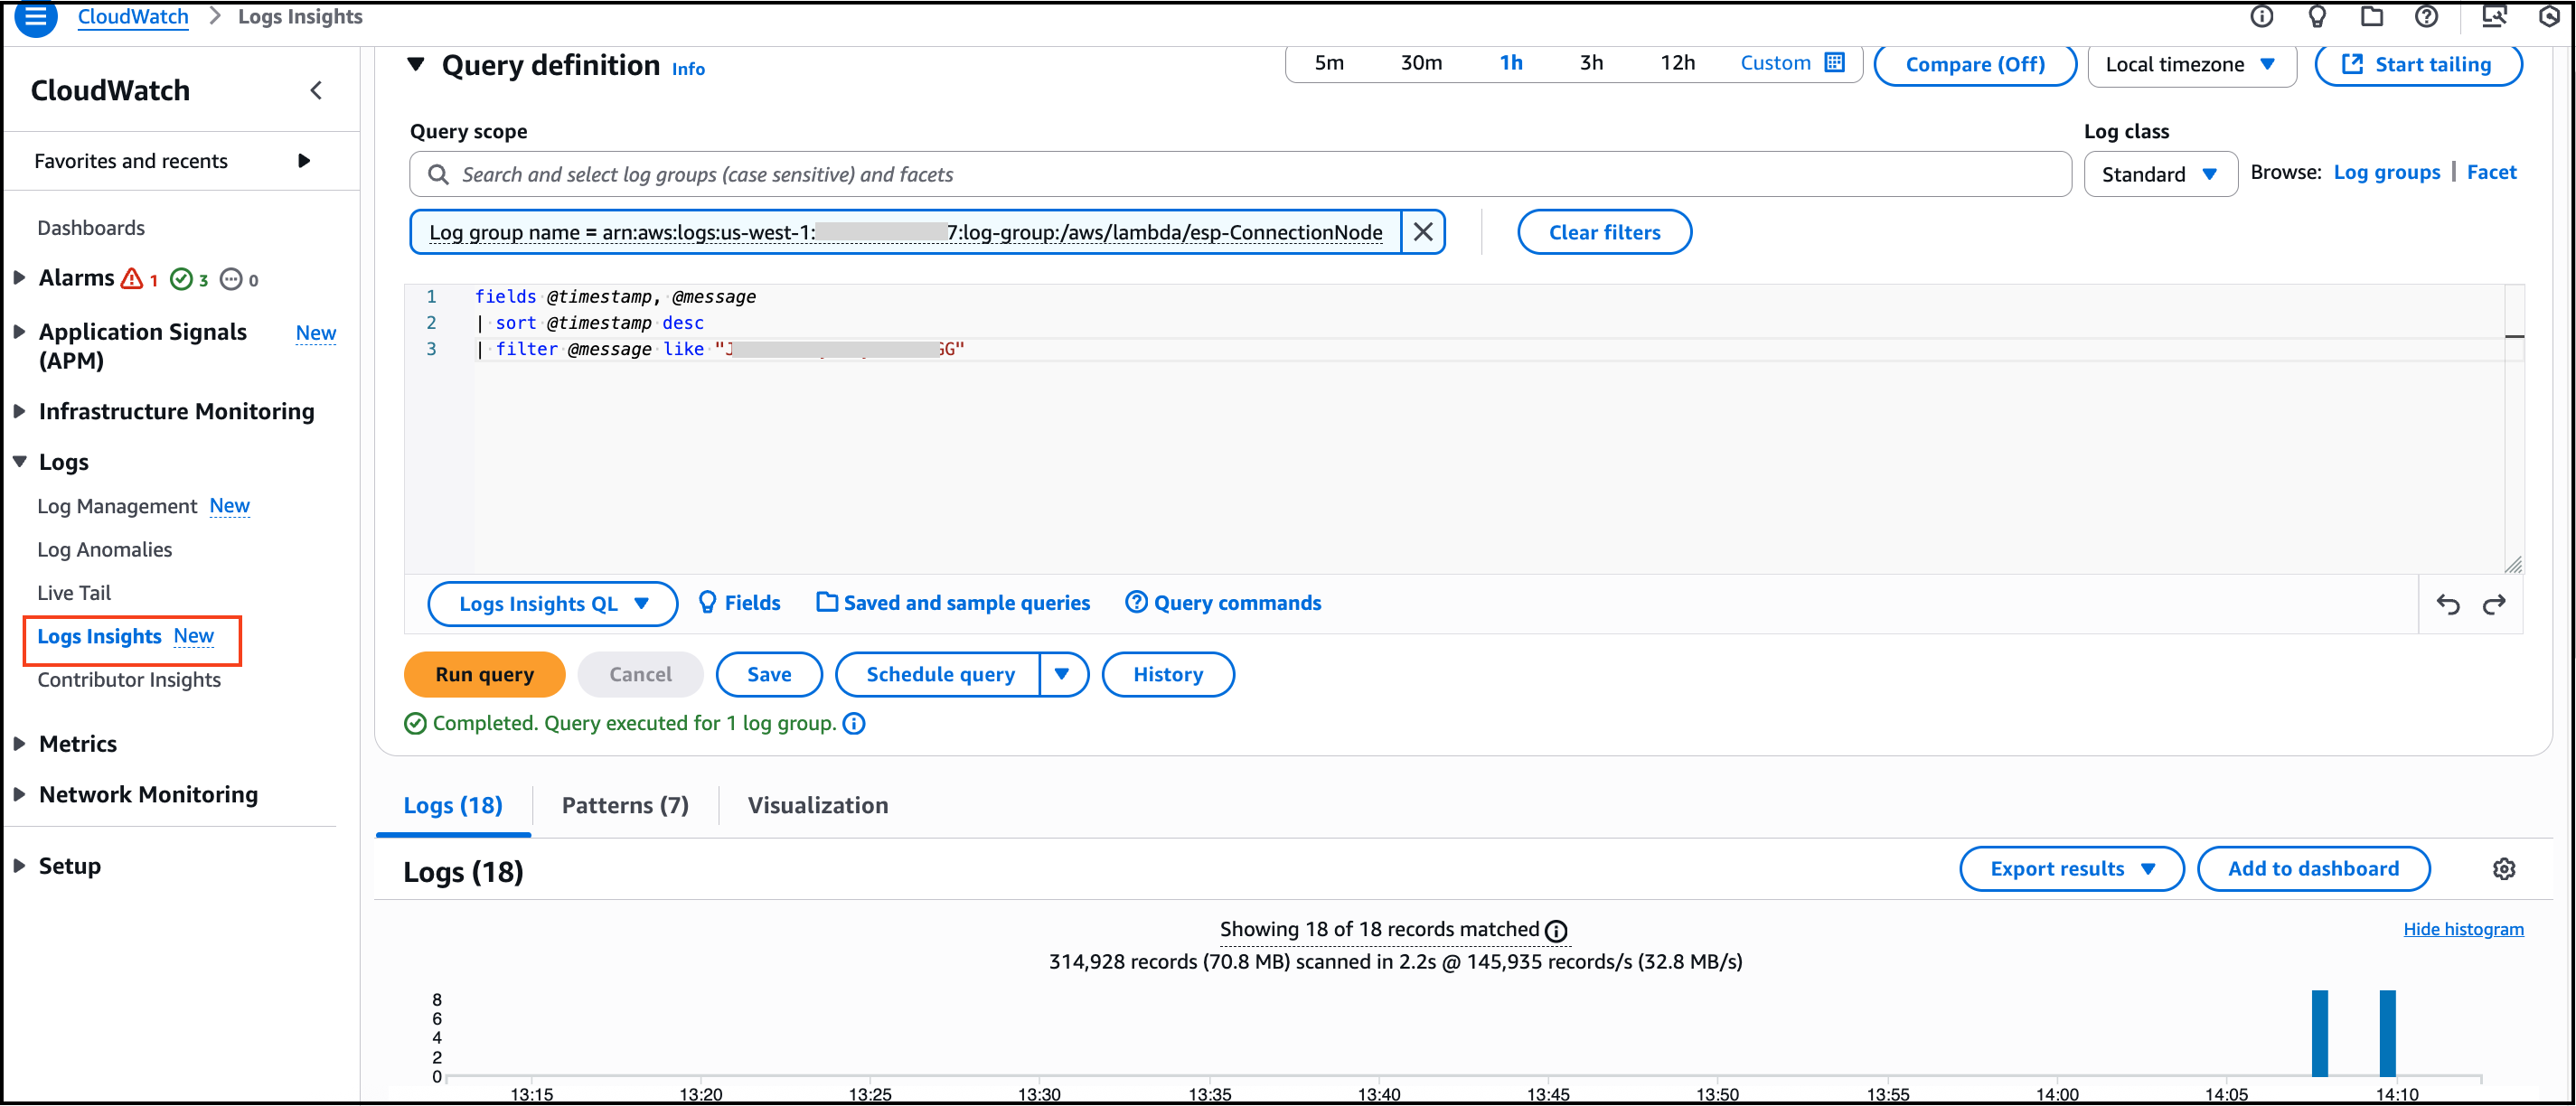
If you need to check and debug connection logs for a particular node, you can use CloudWatch Logs Insights to filter logs by node ID.
Follow these steps to query logs for a specific node:
- Sign in to the AWS Management Console.
- Navigate to the CloudWatch service.
- In the left navigation pane, click on Logs > Logs Insights.
- In the Select log group(s) dropdown, search for and select
/aws/lambda/esp-ConnectionNode. - In the query editor, enter the following query:
fields @timestamp, @message
| sort @timestamp desc
| filter @message like "<node_id>"
Replace <node_id> with the actual node ID you want to debug.
-
Select the appropriate time range based on your use case:
- Last 1 hour - For recent connection issues
- Last 4 days - For investigating issues over a few days
- Last 1 week - For historical analysis
- Custom - To specify a specific date and time range
-
Click Run query to execute the query and view the filtered logs.
You can further refine your query by adding additional filters or adjusting the time range to narrow down the results.